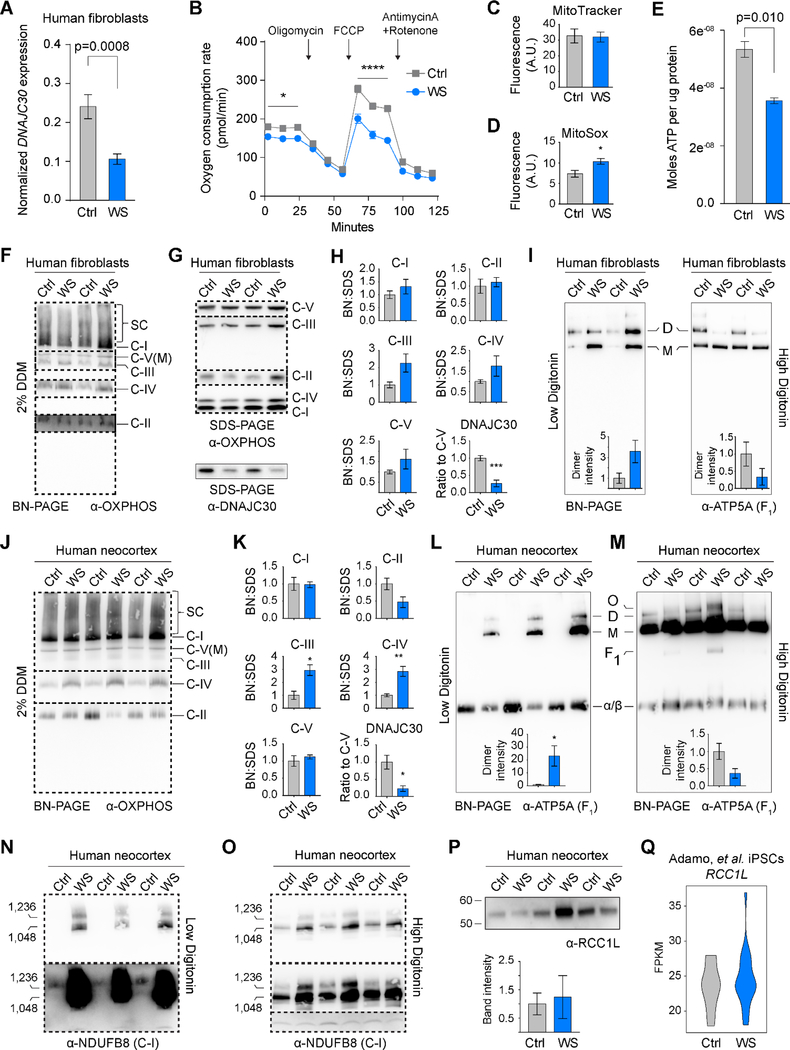
Figure 7. Oxidative Phosphorylation Supercomplexes are Dissociated in Williams Syndrome.
(A) Expression ratio (DNAJC30:TBP) in human fibroblasts (Ctrl, n=3; WS, n=9). (B) Seahorse Mito Stress Kit assay on Ctrl (n=4) and WS (n=4) fibroblasts. Arrows denote timing of pharmacological modification. (C) Relative mitochondrial membrane potential as measured by MitoTracker labeling. (D) Relative ROS levels as measured by MitoSOX labeling. (E) Luciferase assay shows decreased ATP synthesis in fibroblasts from patients affected with WS (Ctrl, n=3; WS, n=9). (F) OXPHOS cocktail western blot following BN-PAGE of human fibroblast mitochondria treated with 2% Dodecyl β-D-maltoside (DDM). Different dashed boxes indicate different exposures of the same membrane. (G) SDS-PAGE and western blots of human fibroblast samples. (H) Ratios of OXPHOS complexes and DNAJC30 as measured in BN- and SDS-PAGE. DNAJC30 was normalized to ATP5A of the SDS-PAGE western blot. (I) BN-PAGE and western blots for ATP5A on human fibroblast mitochondria treated with low or high digitonin concentrations Complex V dimers (D), monomers (M) are seen (p=0.097 and p=0.194, for left and right histograms, respectively). (J-K) As in F and H, but with human neocortical samples. (L) Western blot for ATP5A after low detergent treatment shows Complex V dimers, monomers, and the alpha and beta hetero-hexamer component of F1 subunit (α/β). The inset shows relative band intensity of dimers. (M) As in panel L, but with a higher detergent treatment (p=0.077) (O, oligomer; F1, intact subunit: α/β hexamer and central stalk). (N-O) Western blots for NDUFB8 after low and high digitonin treatments, respectively. (P) Western blot of RCC1L in WS NCX, and quantified after normalizing to ATP5A (p=0.790). (Q) Violin plots for RCC1L RNA-seq expression obtained from previously published Adamo, et al. (meanCtrl=23.56536, meanWS=24.52450, Welch two-sample t-test p=0.4405). *, p<0.05; **, p<0.01; ****, p<0.0001 using a student’s t-test. See also Figure S7.

