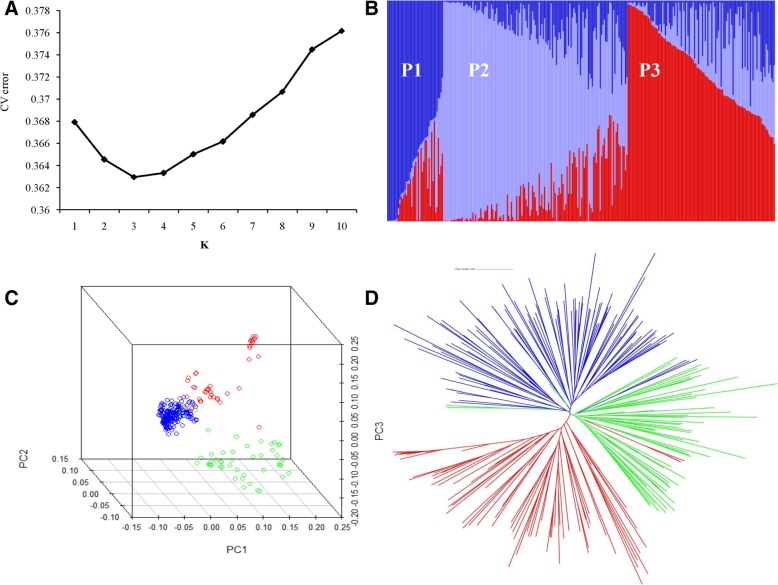
Fig. 2.
Population structure of 295 japonica rice varieties. a, The CV error of each K value. b, Subgroups (K = 3) inferred using ADMIXTURE software. c, Principal component analysis of 295 japonica rice varieties. Colors of green, blue, and red represent P1, P2 and P3 in Fig. 2b, respectively. d, Neighbor-joining tree of 295 japonica rice varieties. Colors of green, blue, and red represent P1, P2 and P3 in Fig. 2b, respectively

