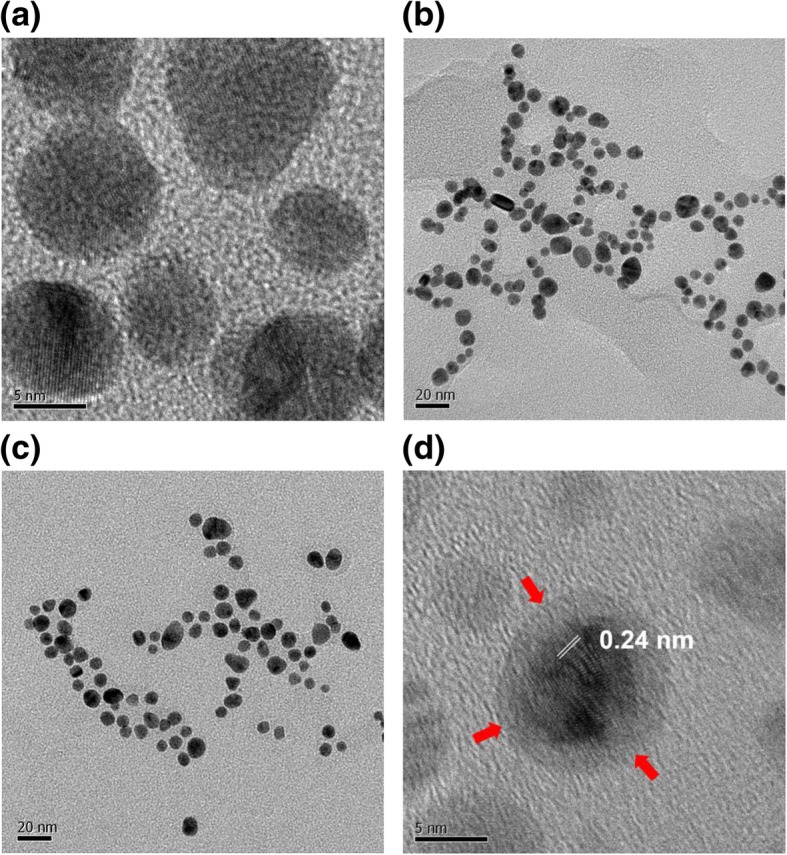
Fig. 4.

HR-TEM images of gold nanospheres. The scale bars represent a 5 nm, b 20 nm, c 20 nm, and d 5 nm. Images a and b were obtained without chitosan capping, and c and d were obtained with chitosan capping. The distance between neighboring lattices was measured to be 0.24 nm. Red arrows indicate the chitosan layer after capping
