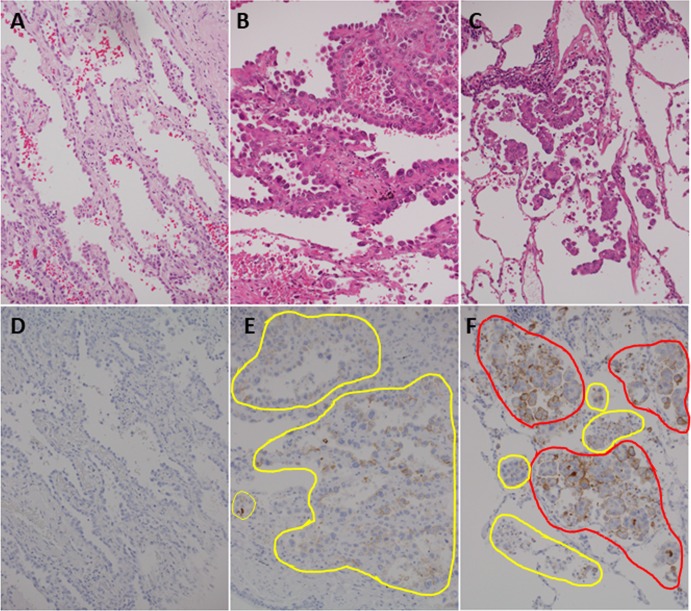
Fig 1. Representative images of tumors with varying immunohistochemical scores.
Tumor cells with weak signal (intensity 1) are in the yellow circle, and tumor cells with strong signal (intensity 2) are in the red circle. In the left panels, positive signal is not detected throughout the tumor (Score 0) (A and D). In the center panels, weak signal is detected in most (90%) neoplastic cells (score 90 = 1×90) (B and E). In the right panels, strong signal is detected in most (80%) neoplastic cells (score 180 = 1×20 + 2×80) (C and F). A, B, and C are the hematoxylin and eosin stain. D, E, and F are immunohistochemistry for MUC21 with the polyclonal antibody. Magnification of all images is 200×.

