
Fig 2. Correlations between MUC21 immunohistochemical scores and MUC21 mRNA levels.
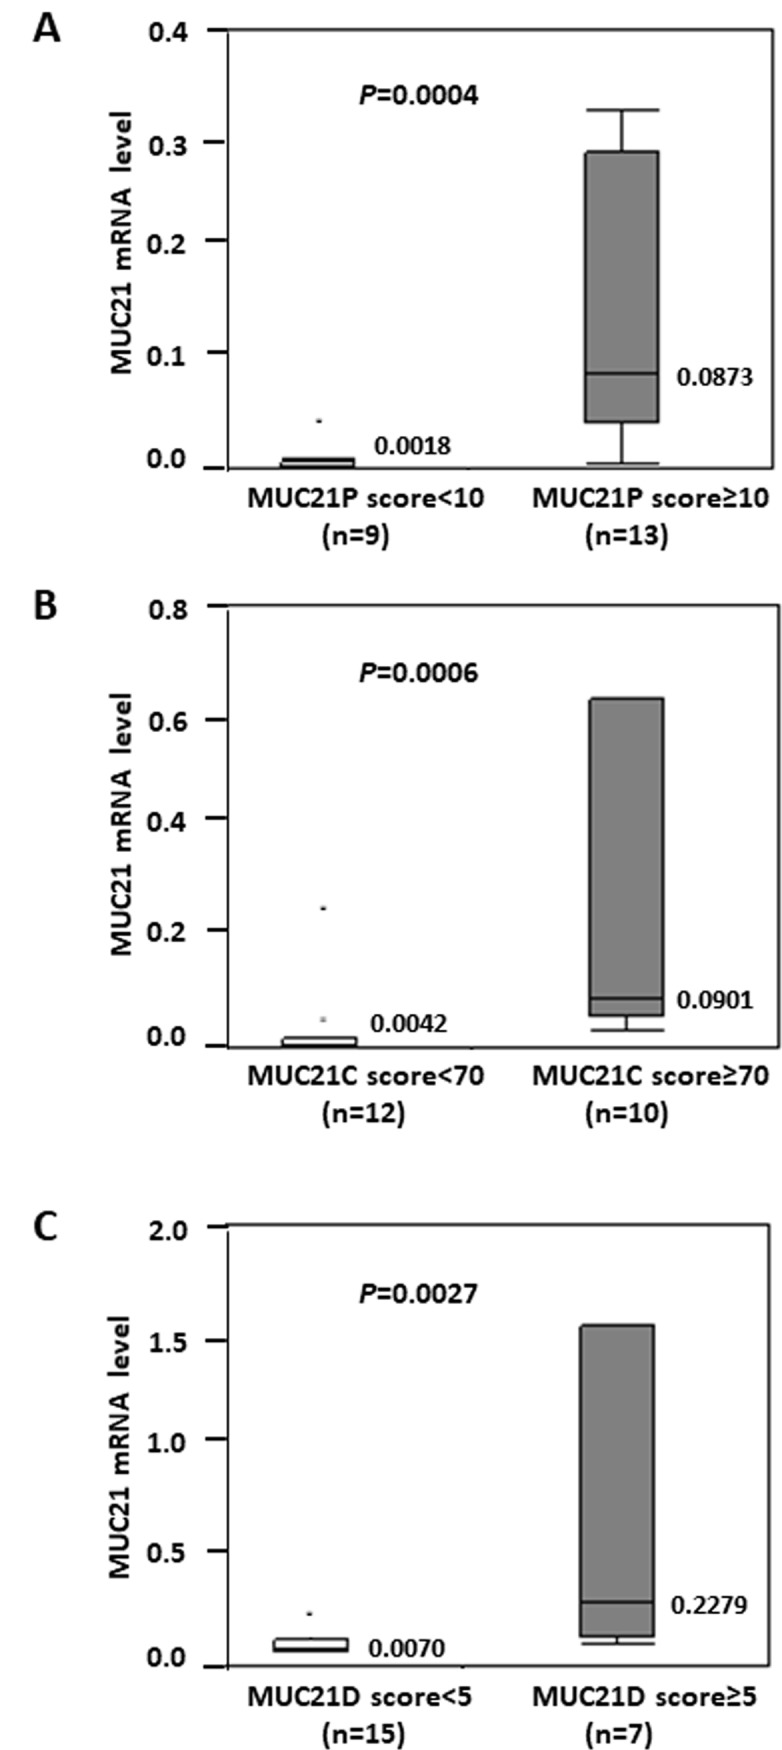
MUC21 mRNA levels are displayed as a box-and-whiskers plot (median, thick line; 25th to 75th percentile, box; 10th to 90th percentile, whiskers; outliers, dots). The cut-off immunohistochemical score was set to obtain the lowest P-value for the correlation between MUC21 mRNA and each MUC21 immunohistochemical expression; MUC21P (A, cut-off value of 10), MUC21C (B, cut-off value of 70), and MUC21D (C, cut-off value of 5). Median values are described in the graphs. P values were calculated using the Mann-Whitney test. n, number of tumors examined. A total of 22 EGFR-mutated lung adenocarcinomas were examined.