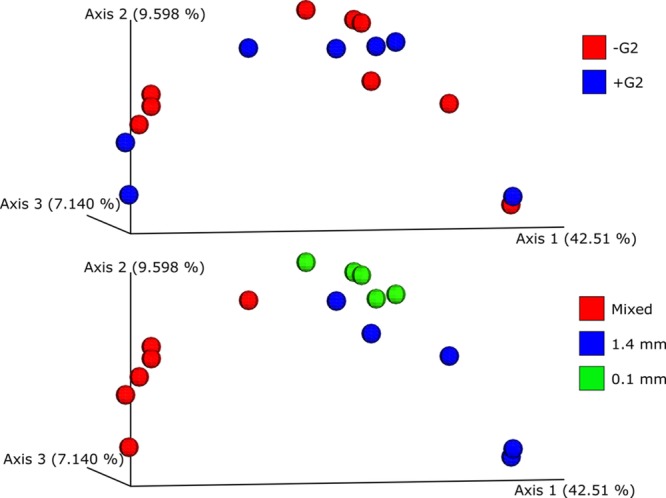
Fig 5. PCoA plots obtained from the UniFrac distance matrix of the sequenced samples from the different tube preparations.

(A) Comparison of data obtained from samples with G2 (blue dots) and without G2 (red dots). (B) Comparison of data obtained from samples using 0.1 mm beads (green dots), 1.4 mm beads (blue dots) and mixed beads (red dots).
