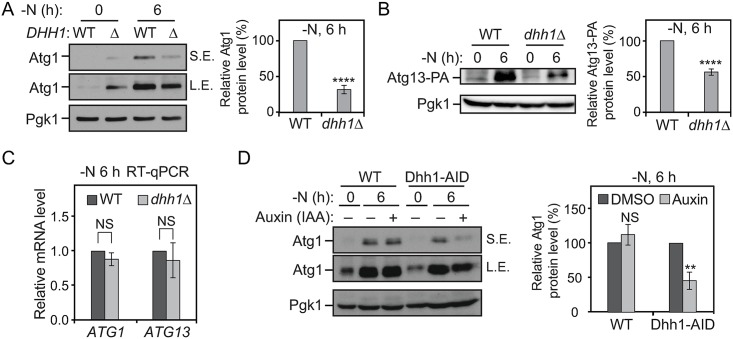
Fig 2. Dhh1 promotes the translation of Atg1 and Atg13 under nitrogen-starvation conditions.
(A) WT (SEY6210) and dhh1Δ (XLY301) cells were grown in YPD to mid-log phase (-N, 0 h) and then shifted to SD-N for 6 h. Cell lysates were prepared, subjected to SDS-PAGE, and analyzed by western blot. For quantification of Atg1 protein level in cells after prolonged nitrogen starvation, the Atg1 protein level was first normalized to the loading control, Pgk1. The values of the dhh1Δ mutant samples were then normalized to that in WT cells. Average values ± s.d. of n = 3 independent experiments are shown as indicated. ****p < 0.0001. (B) Atg13–PA (ZYY202) and Atg13–PA dhh1Δ (ZYY203) cells were grown in YPD to mid-log phase (-N, 0 h) and then shifted to SD-N for 6 h. Cell lysates were prepared, subjected to SDS-PAGE, and analyzed by western blot. The quantification of Atg13 protein level was conducted as indicated in (A). The 5′-UTR and 3′-UTR of ATG13 in these strains were not changed. ****p < 0.0001. (C) Atg13–PA and Atg13–PA dhh1Δ cells were grown in YPD to mid-log phase (-N, 0 h) and then shifted to SD-N for 6 h. Total RNA for each sample was extracted, and the mRNA levels were quantified by RT-qPCR. The mRNA levels of the samples were first normalized to the level of the reference gene TAF10. Then, individual ATG1 and ATG13 mRNA levels were normalized to the mRNA level of the corresponding gene in WT cells. Error bars represent the SD of three independent experiments. (D) WT (XLY338) and Dhh1–AID (XLY340) cells were grown in YPD to mid-log phase and treated with either DMSO or 300 μM IAA for 30 min. They were then shifted to SD-N for 6 h in the presence of either DMSO or IAA. Cell lysates were prepared, subjected to SDS-PAGE, and analyzed by western blot. For quantification, the Atg1 protein levels were first normalized to the loading control, Pgk1. The values of the IAA-treated samples were then normalized to that in DMSO (IAA “-”)-treated samples. Average values ± s.d. of n = 3 independent experiments are shown as indicated. **p < 0.01. (See also S2 and S3 Figs; raw numerical values are shown in S1 Data). Atg, autophagy-related; DMSO, dimethyl sulfoxide; IAA, indoe-3-acetic acid; L.E., long exposure; NS, not significant; PA, protein A; Pgk1, 3-phosphoglycerate kinase 1; RT-qPCR, quantitative reverse transcription PCR; SD-N, synthetic minimal medium lacking nitrogen; S.E, short exposure; TAF10, TATA binding protein-associated factor 10; WT, wild type; YPD, yeast extract–peptone–dextrose.

