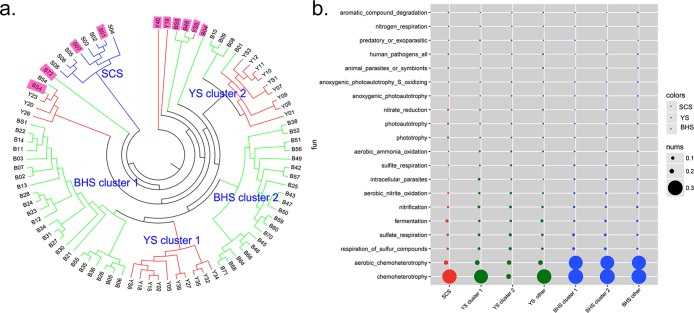
Fig 5.
(a) Cluster analysis showing the similarity of bacterial communities recovered from 86 sampling sites in the SCS, YS and SCS based on the OTU numbers of each sampling station. Eighty-six sampling sites could be classified into seven clusters. (b) Functional analysis of microbial communities. Bubbleplot representing the functional microorganisms in the seven clusters from the three China Seas.

