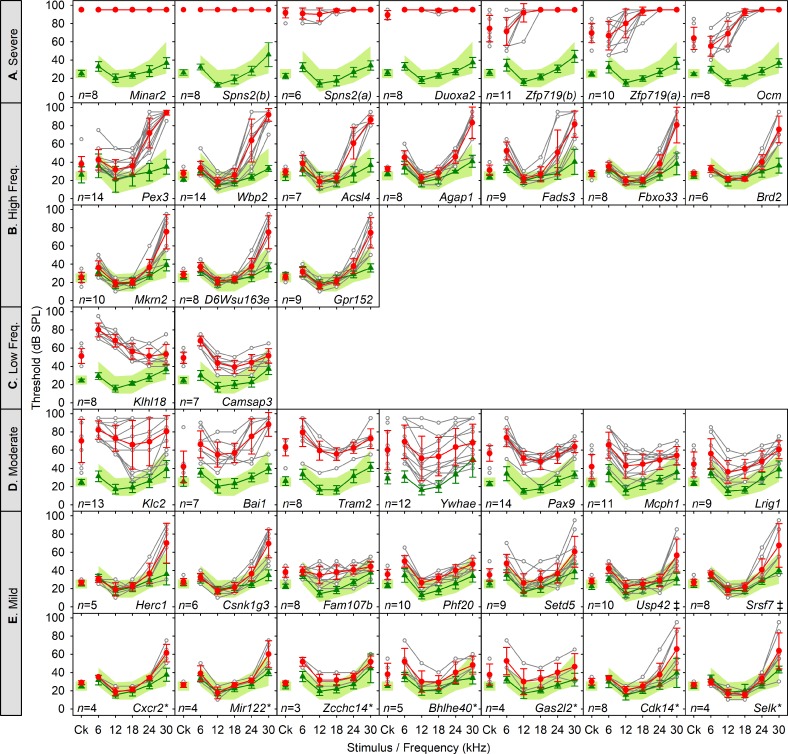
Fig 1. Novel genes affecting hearing sensitivity.
New mutant mouse lines with hearing impairment categorised as Severe–Profound (A), High frequency (B), Low frequency (C), Moderate (D), and Mild (E) at 14 weeks old. Mean ABR thresholds (±SD) are plotted for broadband clicks (Ck) and 6 to 30 kHz pure tone stimuli. On each panel, the green band denotes the 95% reference range for a large population of control wild-type mice derived from littermates of the mutants generated and tested. Green lines and triangles represent the mean thresholds (±SD) for control mice recorded in the same week as the mutants. Red circles and lines represent the mean thresholds (±SD) for mutant mice. Thresholds for individual mutants are shown by open grey circles and lines. Gene symbols are given on each plot, and when both the tm1a and tm1b alleles were screened, both sets of data are presented, indicated by (a) and (b) suffixes. Mice screened were homozygous mutants except for Brd2, Srsf7, and Setd5, which were screened as heterozygotes due to reduced viability of homozygotes. When no response was detected up to the maximum dB SPL used (95 dB SPL), the maximum sound level used was plotted. Only 12 of these mutant lines (35%) would have been identified as having a hearing defect had startle responses alone been used to screen (S1 Table). The number of mutant mice screened of each line is given in column E of S1 Table and on each panel. A few of these lines (Spns2, Wbp2, Lrig1, Ocm, Mcph1, Pax9, or Slc25a21) have been characterised and published, and others were listed in a summary report (Zcchc14, Adgrb1, Tram2, Klc2, Acsl4, Gpr152, Klhl18, Zfp719, A730017C20Rik/Minar2, and Duoxa2) [7] because they were first detected in the current screen, but are included in the group analysis here, as they were not known to be involved in auditory function before the screen. Asterisks indicate lines that were called using the reference range or 20 dB rules described in the Materials and methods but were not significant calls using the Fisher Exact test; ‡ indicates lines that were not significant by the Fisher Exact test but did show raised thresholds when other cohorts were tested later. Plotted data points are given S5 Data. ABR, auditory brainstem response; Ck, click; SPL, sound pressure level.

