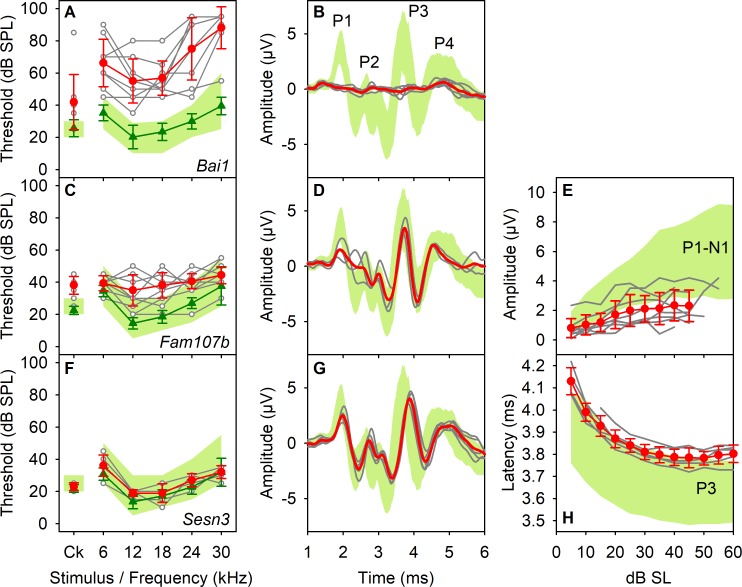
Fig 6. Genes affecting central auditory system function.
Examples of three mutant mouse lines with altered ABR waveforms are shown. ABR thresholds are plotted in the left column, click-evoked ABR waveforms recorded at 50-dB SL in the second column, and IOFs (parameter versus stimulus level above threshold, dB SL) are plotted in the third column. The green band denotes the 95% reference range of control values (defined in Methods). Red lines and circles represent mean responses (±SD) from mutant mice. Responses from individual mutants are shown by grey lines and open circles. Green lines and triangles represent the mean thresholds (±SD) for control mice recorded in the same week as the mutants. A,B. The Bai1 (Adgrb1) mutant line produced ABRs that were grossly abnormal. C-E. The Fam107b mutants produced a mild increase in thresholds but also have ABR waveforms with significantly reduced wave 1 amplitude. F-H. Sesn3 mutants showed normal thresholds but prolonged P3 latency. Plotted data points are given in S10 Data. ABR, auditory brainstem response; IOF, input-output function; SL, sensation level; SPL, sound pressure level.

