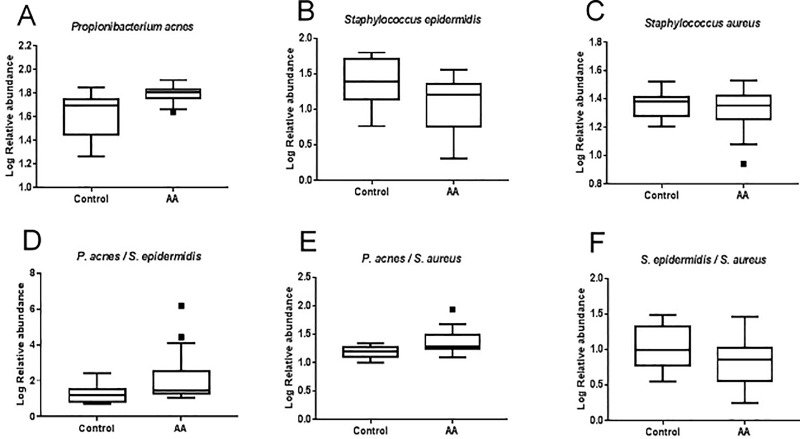
Fig 2. Relative abundance of main bacterial species on the scalp of AA and control subjects by RT qPCR.
Box and Whisker comparing the log relative abundance of P. acnes, S. epidermidis and S. aureus collected by swabbing the scalp. (A) Log Relative abundance of P. acnes in Control and AA subjects. (B) Log Relative abundance of S. epidermidis in Control and AA subjects. (C) Log Relative abundance of S. aureus in Control and AA subjects. Ratios P. acnes/ S. epidermidis (D), P. acnes/ S. aureus (E) and S. epidermidis / S. aureus (F) in Control and AA subjects. Values are presented as mean +/- SEM, in duplicate. Box-and-Whiskers plot showing median with 25th to 75th percentile. The center line of each box represents the median; data falling outside the whiskers range are plotted as outliers of the data.

