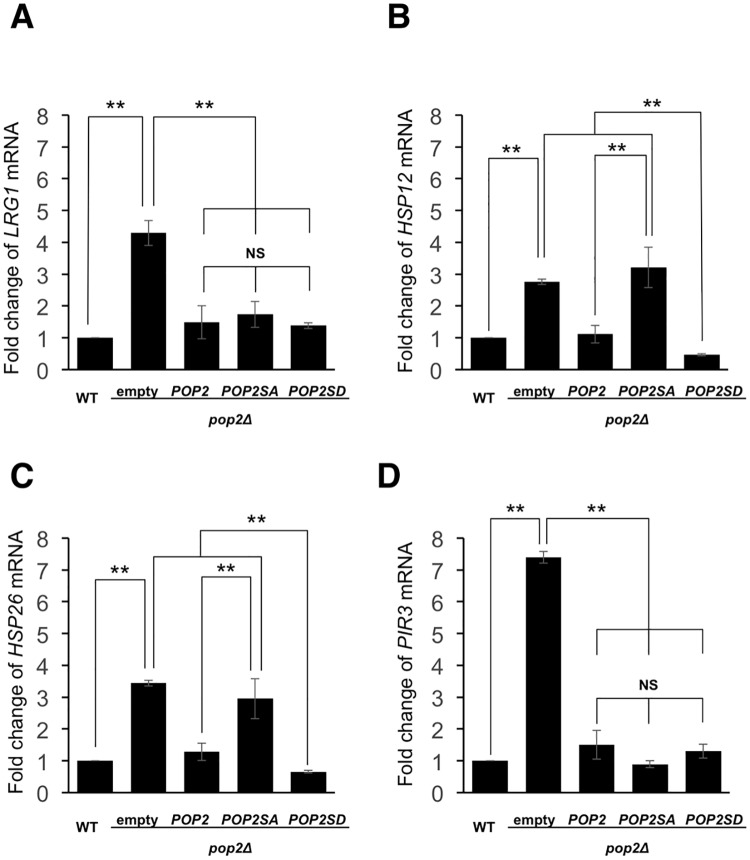
Fig 3. Effect of the S39 phosphorylation on the LRG1, HSP12, HSP26 and PIR3 expression in glucose-containing medium.
(A, B, C, D) Expression of LRG1, HSP12, HSP26, PIR3 mRNAs in WT harboring YCplac33 (empty vector) and pop2Δ harboring YCplac33, YCplac33-POP2FLAG, YCplac33-POP2S39AFLAG, YCplac33-POP2S39DFLAG. The cells were grown at 30°C until exponential phase and collected for RNA isolation. mRNA levels were quantified by qRT-PCR. The relative mRNA levels were calculated using delta delta Ct method normalized to ACT1 reference gene. The data show mean ± the standard deviation (n = 3). NS, not significant, **P < 0.01 as determined by Tukey’s test.

