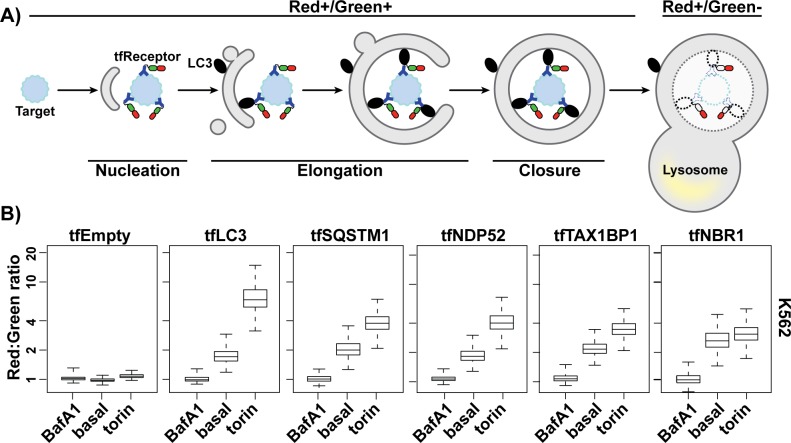
Fig 1. An expanded toolkit of autophagy reporters performs comparably to tfLC3.
(A) Schematic depicting how tfReceptors measure autophagic flux. tfReceptors bind to targets and interface with additional components of the autophagy machinery such as lipidated LC3 (black ovals). GFP fluorescence is selectively quenched in low pH environments, leading to an increased Red:Green ratio upon exposure of tfReceptor to the lumen of the lysosome. Dashed lines indicate degradation by lysosomal hydrolases. (B) K562 cells expressing the indicated tf proteins from the AAVS1 locus were analyzed by flow cytometry under basal conditions and after 18 h treatment with 100 nM BafA1 or 250 nM torin. Values for each reporter were normalized to BafA1 treatment. Plots show median Red:Green ratios, inner quartiles (boxed regions), and 10th and 90th percentile (whiskers). n > 1,000 cells for each sample. Related to S1 Fig. Underlying data for all summary statistics can be found in S1 Data. AAVS1, adeno-associated virus integration site 1; BafA1, Bafilomycin A1; GFP, green fluorescent protein; LC3, microtubule-associated protein 1 light chain 3B; NBR1, neighbor of BRCA1 gene 1; NDP52, nuclear dot protein 52; SQSTM1, sequestosome 1; TAX1BP1, tax 1 binding protein 1; tf, tandem-fluorescent.

