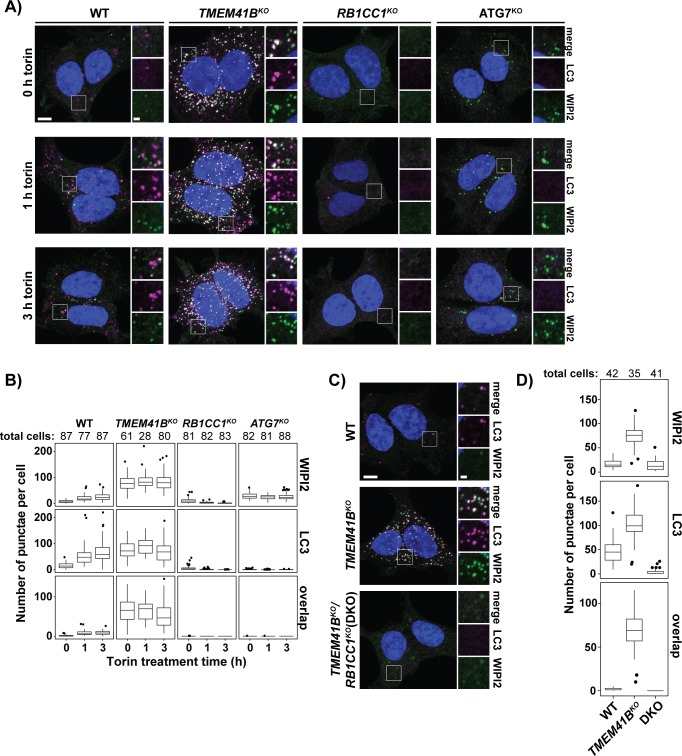
Fig 6. TMEM41BKO cells accumulate unresolved intermediates in autophagosome biogenesis.
(A) Wild-type and indicated HEK293T knockout cells were treated with 250 nM torin for the indicated times prior to analysis by confocal microscopy. Shown are representative confocal micrographs (as maximum intensity projections). Selected regions (white boxes) of micrographs are shown as insets of single and merged channels from IF against indicated proteins. LC3, magenta; WIPI2, green; merged, white; Hoechst, blue. Scale bars: large panels, 5 μm; small panels, 1 μm. (B) Plots showing means of indicated punctae in wild-type and HEK293T knockout cells imaged in part A with inner quartiles (boxed regions), 1.5 interquartile ranges (whiskers), and outliers (dots) indicated. Sample size (n) for each sample is indicated. (C) Representative confocal micrographs (as maximum intensity projections) of wild-type and indicated single and DKOs of HEK293T cells analyzed by confocal microscopy. Selected regions (white box) of micrographs are shown as insets of single and merged channels from IF against indicated proteins. LC3, magenta; WIPI2, green; merged, white; Hoechst, blue. Scale bars: large panels, 5 μm; small panels, 1 μm. (D) Plots showing means of indicated punctae in cells imaged in part C with inner quartiles (boxed regions), 1.5 interquartile ranges (whiskers), and outliers (dots) indicated. Sample size (n) for each sample is indicated. Related to S5 Fig. Underlying data for all summary statistics can be found in S1 Data. ATG, autophagy-related; DKO, double knockout; HEK, human embryonic kidney; IF, immunofluorescence; LC3, microtubule-associated protein 1 light chain 3B; RB1CC1, RB1 Inducible Coiled-Coil 1; TMEM41B, transmembrane protein 41B; WIPI2, WD Repeat Domain, Phosphoinositide Interacting 2.

