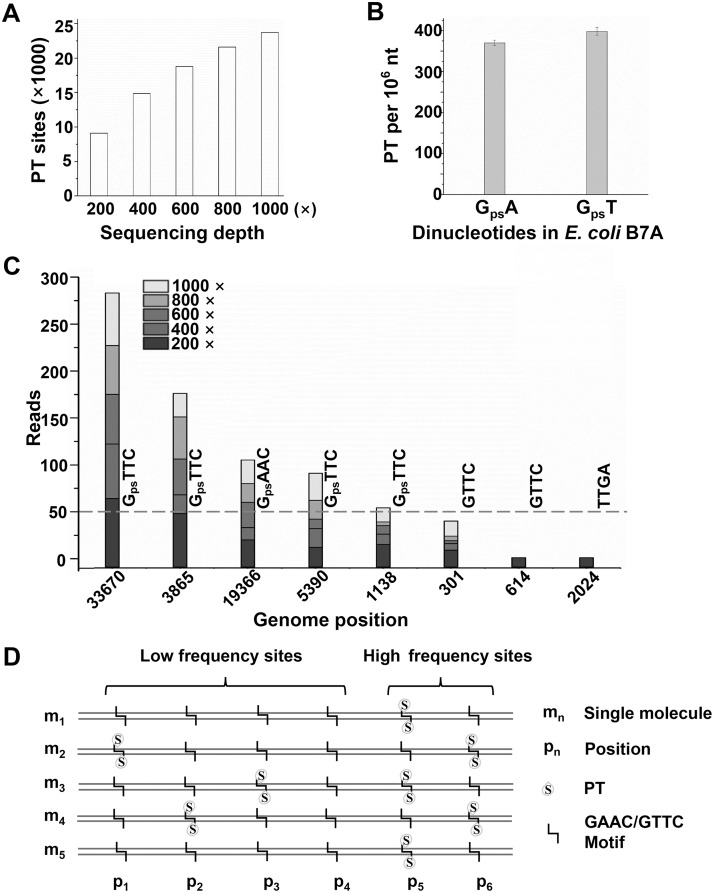
Fig 1. Discovery of new PT sites using deep resequencing and the inconsistency between extensive PT modified sites and the PT linked dinucleotides abundance of the E. coli B7A genome.
(A) Plotted PT modified sites detected with the increase of sequencing depth. (B) The PT abundances quantified by LC-MS/MS. Error bars are calculated as the s. d. of three biological replicates. (C) Accumulation of sequencing depth contributed to the revealing of more PT-modified sites. Here, one loci are chosen for each case as an example to illustrate each situation: some sites like loci 33670, the ended reads number of which reached 50 at 200 × was detected as PT modified sites, while some sites like 3865 loci only be regarded as PT modified site when the sequencing depth increase up to 400 ×. In other word, if the sequencing depth is only 200 ×, they would be identified as non-PT modified sites. Similar phenome can be seen at the sites like 19366 loci (600 ×), 5390 loci (800 ×) and 1138 loci (1000 ×). Also, some sites like 301 loci, the ended reads number of which could not reach 50 even the sequencing depth increased up to 1000 ×. While, some GAAC/GTTC sites like 614 loci and some randomly selected non GAAC/GTTC sites like 2024 loci, the ended reads number could not be detected at each five gradient sequence depth. (D) The schematic molecular PT modification. The specific GAAC/GTTC site is partially modified and with different modification frequency. High frequency sites are easy to detected and low frequency sites need further sequencing depth.

