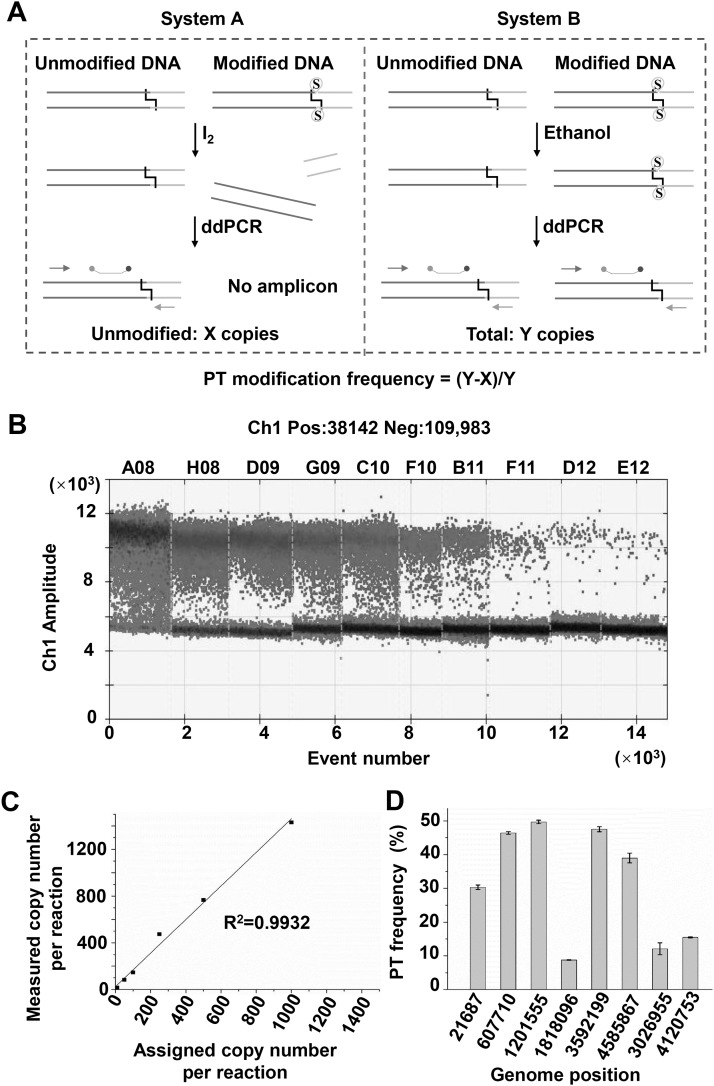
Fig 5. PT-IC-ddPCR quantify PT modification frequency.
(A) Schematic diagram of the PT-IC-ddPCR quantified the DNA PT modification frequency at a specific site. Left (System A): DNA sample was firstly treated with iodine, then unmodified DNA was quantified as X copies by ddPCR using the primers and probe; Right (System B): Total DNA was quantified as Y copies by droplet digital PCR using the same primers and probe; the modified DNA was calculated as Y-X and the PT modification frequency was calculated as (Y-X)/Y. (B) The one-dimensional (1D) scatter plot of serial concentration of E. coli B7A by droplet digital PCR. (C) Dynamic range and correlation of the ddPCR assay for quantification of PT modification frequency at 1818096 loci in E. coli B7A genome. The observed positive droplets matched well with the predicted values according to Poisson statistics (R2 = 0.9932). (D) The PT modification frequency of 8 loci (G1-G8), each value was the mean based on at least three measurements.

