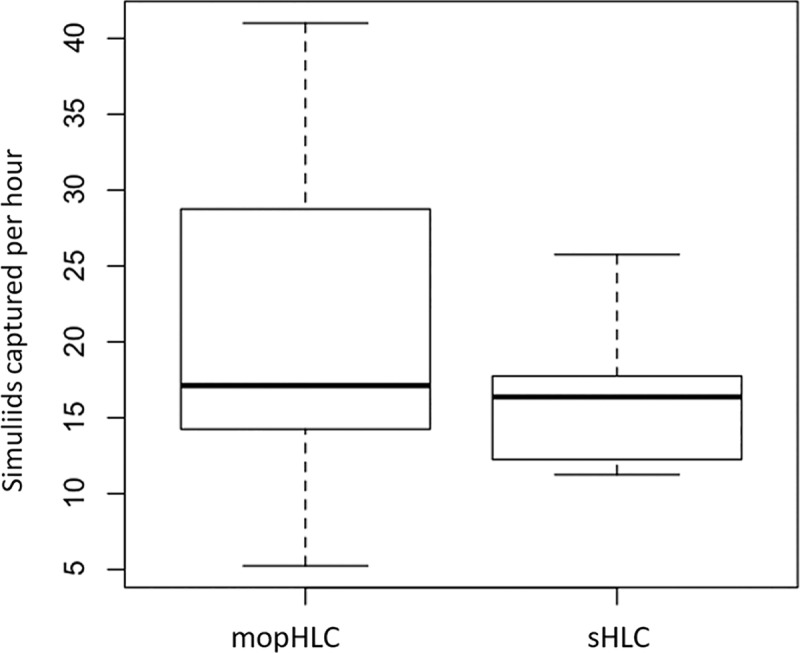
Fig 4. Shows a trapping efficiency comparison between mopHLCs and sHLCs.

The raw data used to prepare these box plots is shown in Tables 1 and 2 and derives from six vector collectors who performed both collection techniques simultaneously on the 26th of October 2017. The Y-axis of the graph shows the efficiency with which simuliids were trapped in units of “simuliids captured per hour”.
