
Fig 6. Shows a capture efficiency comparison between sHLCs and mopHLCs performed in isolation of sHLCs.
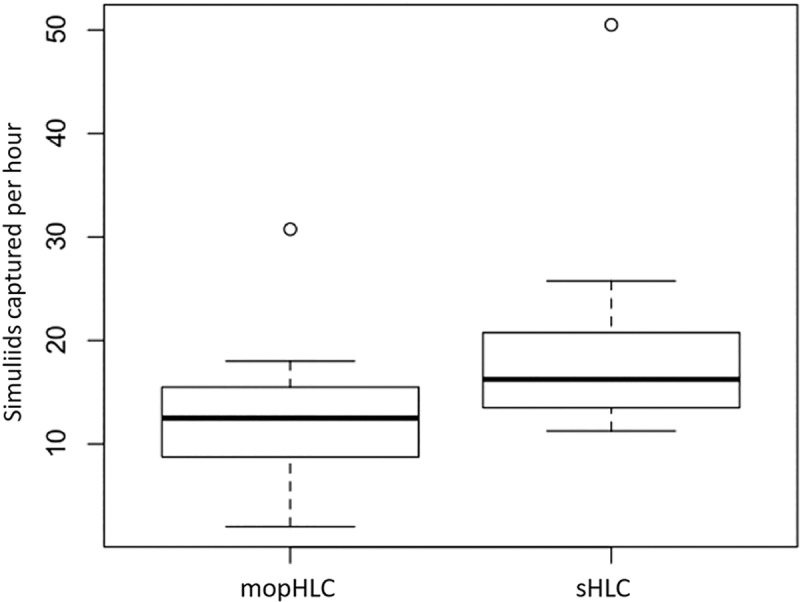
The box plots uses data from the eight mopHLCs (performed between the 27th and 28th of October 2017) and 10 sHLCs performed between the 26th and 28th of October 2017. The Y-axis of the graph indicates the efficiency with which each technique traps simuliids in units of: “simuliids captured per hour”.