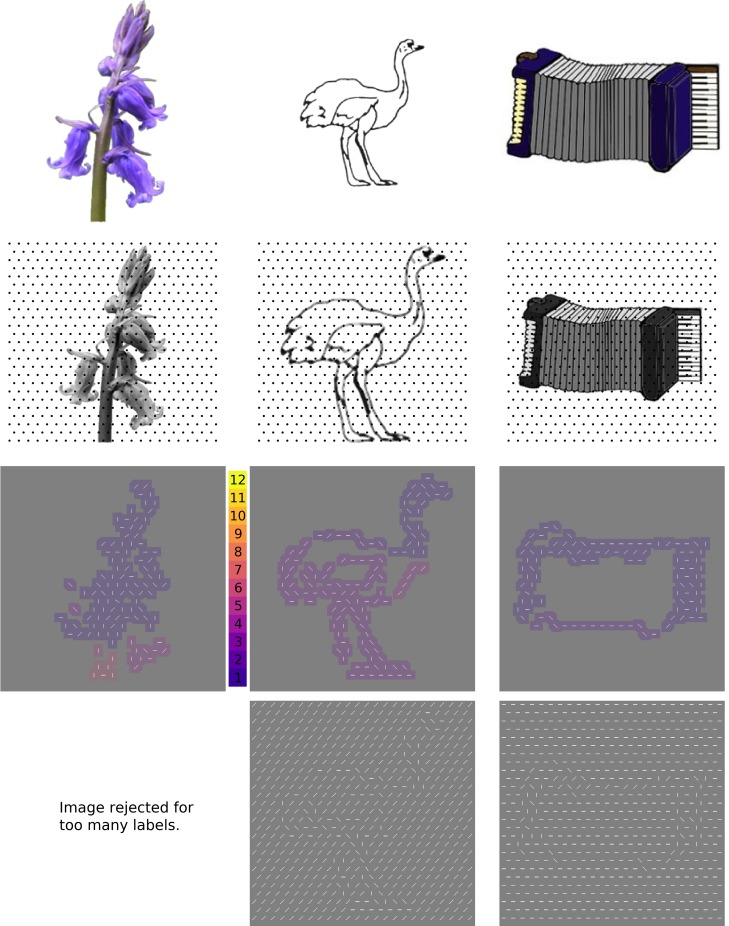
Fig 1. The first (automated) stage of stimulus generation.
Top row: Line drawings, photographs, and full-color drawings of isolated objects were downloaded from existing object databases intended for vision reearch. Second row: Objects were scaled to occupy 88% of a 384x384 pixel square, then an algorithm using a regular grid of Gabor wavelet filters (dots indicate centers of Gabor wavelets) tuned to a range of spatial frequencies and orientations was used to convert local features to oriented line segments. Third row: the resulting array of line segments was convolved with a 16x16 pixel square, then subjected to a clustering algorithm that assigned a different integer to each disconnected region. “Objects” with 6 or more separate regions were eliminated from further consideration Bottom row: Each collection of object “features” was then embedded in a background of line segments at a randomly selected orientation. Credits, from left: bluebell_ed.bmp from http://testbed.herts.ac.uk/HIT/hit_apply.asp, shared free of copyright as stated in {Adlington}; 159.gif and Accordion.jpg from {Rossion} are downloaded from https://figshare.com/articles/Snodgrass_Vanderwart_Like_Objects/3102781, used with permission from Michael Tarr, original copyright CC BY NC SA 3.0 2016.

