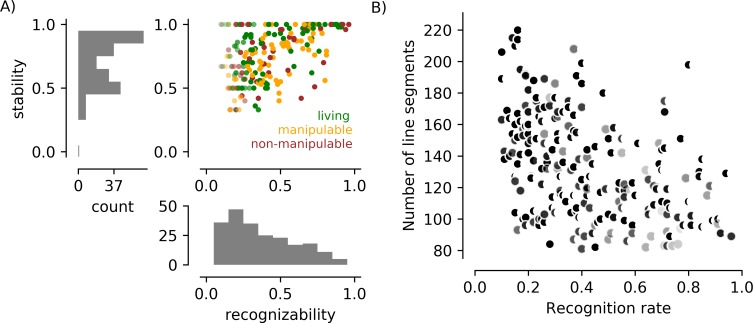
Fig 4. Behavioral responses and line segment counts for all 217 images in a study with naïve participants.
A) The scatter plot shows the recognizability and stability scores for each of the 217 images, with the color of the dot indicating the dominant category for the image. The saturation of points representing images named fewer than 10 times is reduced. The black dot in the lower left indicates an image that was indicated as “recognizable” by 14% of observers in the Yes/No task, but then consistently rejected (by refusal to label) in the Naming task. B) The number of line segments used to describe each object was associated with recognition rates in this image set. The shape of the symbol reflects the convexity score: the more crescent-shaped, the smaller the ratio of the area of the object and the area of a convex bounding region. The darkness of the symbol reflects the density of the object, with black indicating objects that were defined by texture and light gray indicating objects that were defined by contours.

