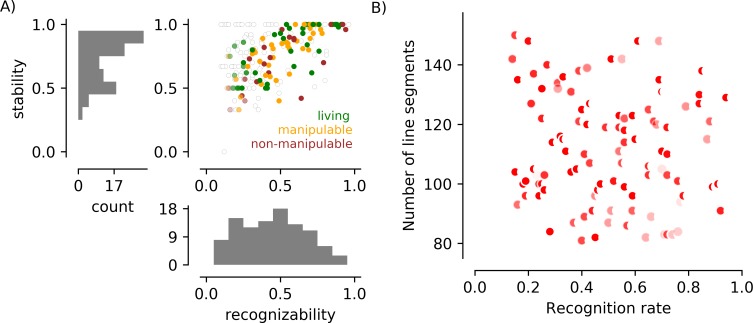
Fig 5. Behavioral responses and line segment counts for the subset of 100 images retained to create the vetted stimulus set.
A) Scatter plot and marginal histograms as in Fig 4. Filled circles indicate stimuli included in the final set of 100 images; empty circles indicate stimuli present in Fig 4 but excluded from the final set. Median recognizability in the final set is 0.51 (mean = 0.51); median stability is 0.82 (mean = 0.77). In the final set of objects there are 40 living and 60 non-living (22 non-manipulable). B) Line segment number is not associated with recognition rate in the final set of 100 stimuli.

