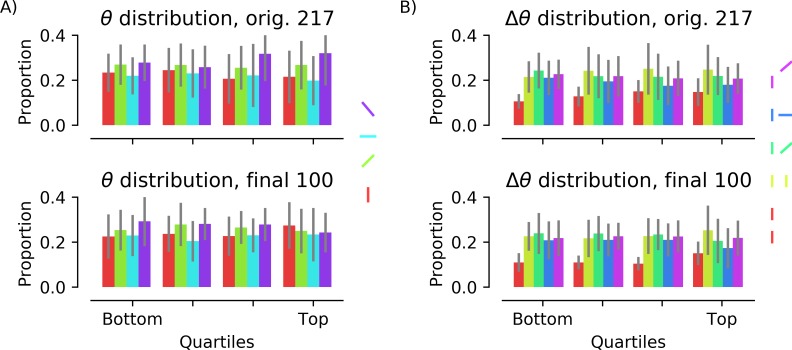
Fig 6. Orientations of line segments in intermediate and final image sets.
A) Color indicates orientation: red, 0°; green, 45°; cyan, 90°; purple, 135°. Images were divided into quartiles based on the proportion of participants who indicated they contained a known object (“recognizability”). The orientations of line segments were not uniformly distributed but there was no correlation between the proportion of line segments at a given orientation and object recognition, r(98) = -0.11, -0.11, 0.092, and 0.10, respectively, for 0°, 45°, 90°, and 135°, all p’s > 0.2. B) Orientation difference between neighboring elements (red: collinear; yellow: parallel; green: acute; blue: orthogonal; purple: obtuse). There was also no correlation between the proportion of stimuli with a given pairwise orientation and object recognition for collinear, r(98) = 0.15, p = 0.14, parallel, r(98) = 0.12, p = 0.25, acute, r(98) = -0.06, p = 0.58, or obtuse, r(98) = -0.11, p = 0.29. The relationship between the proportion of orthogonal pairs and recognizability was the strongest, r(98) = -0.193, p = 0.055.

