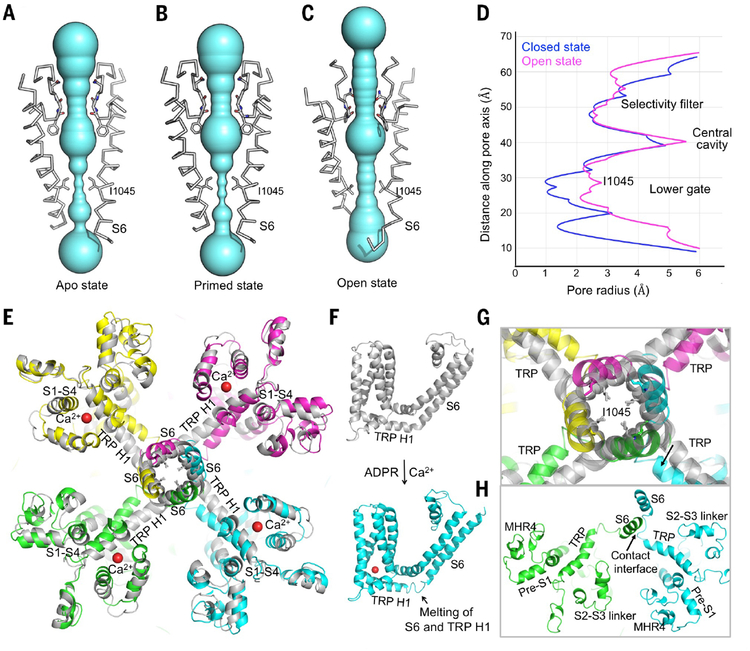
Fig. 5.
Conformational changes of the ion permeation pore. (A to C) Pore-forming domain of TRPM2 in apo (A), ADPR-bound (B), and open (C) states, with key residues lining the pore shown as sticks. The pores are shown as space-filling models and were calculated using the HOLE program (38). (D) Pore radii of apo (blue) and open (magenta) states along the pore axis, calculated as in (A) to (C). (E) Comparison of the TM region in apo (gray) and open (colored) states. Bound Ca2+, S6, TRP H1, and S1-S4 are labeled. (F) TM region of the apo (gray) and open (cyan) states, showing a partial melting of S6 and TRP H1 in the open state. (G) Enlarged view of the conformational change near residue I1045 at the lower gate. (H) The open state conformation may be stabilized by the trans interaction between S6 and the melted S6-TRP helix loop.

