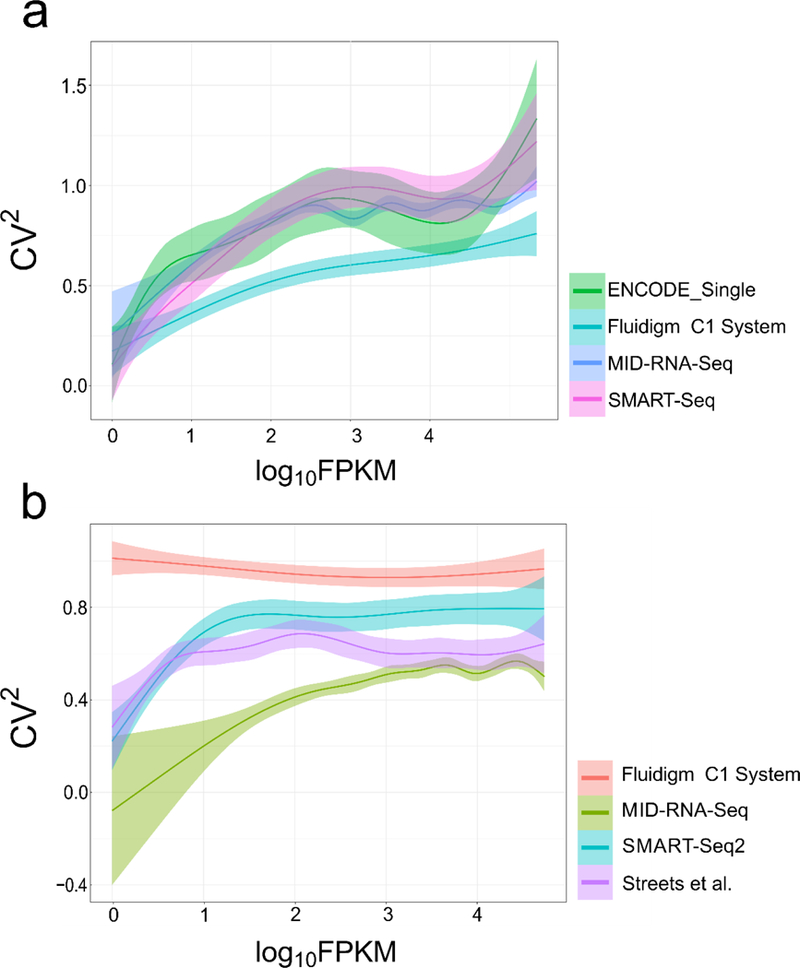
Figure 8.

The relationship between variance (CV2) and FPKM of genes in single cells is shown for a) human and b) mouse cell line samples. Human datasets include ENCODE datasets(GSM2343071/2), SMART-seq from Ref.1, Fluidigm C1 System from Ref. 15. Mouse datasets include SMART-seq2 from Ref. 11, Streets et al. from Ref. 14 and Fluidigm C1 System from Ref. 7. 6 single-cell datasets were randomly picked for each method with each data set containing 2 million randomly sub-sampled reads.
