
Figure. 1. Anti-biofouling setup and proof-of-concept test.
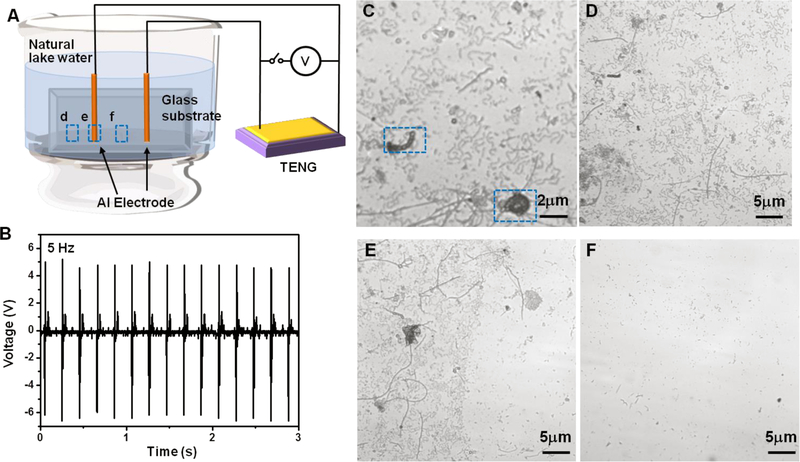
(A), Schematic setup of the anti-biofouling experiment activated by small and low-frequency electrical pulses produced by a TENG. (B), Voltage output profile measured from the TENG, which was used for the anti-biofouling test. (C), Microscopic image of small microbes on an unprotected glass surface showing the initiation of biofouling. (D-F), Microscopic images of the unprotected area (D), the electrode location (E), and the protected area (F), which are marked in (A) accordingly.