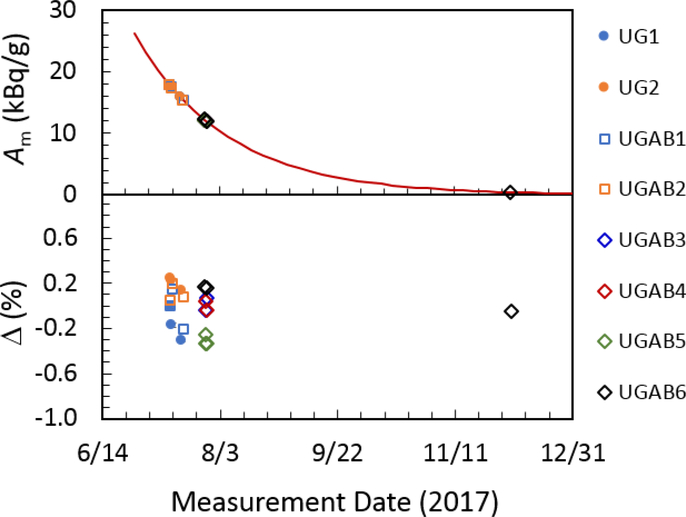
Figure 3.
Decay-corrected LTAC measurement results for 8 LS sources (named in caption). Top: massic activity, Am. Bottom: decay-corrected Am plotted as a percent difference (Δ) from the average (excluding the final measurement, used only as an impurity check). Results from linear efficiency extrapolations (Function 1 in Table 2) are shown.

