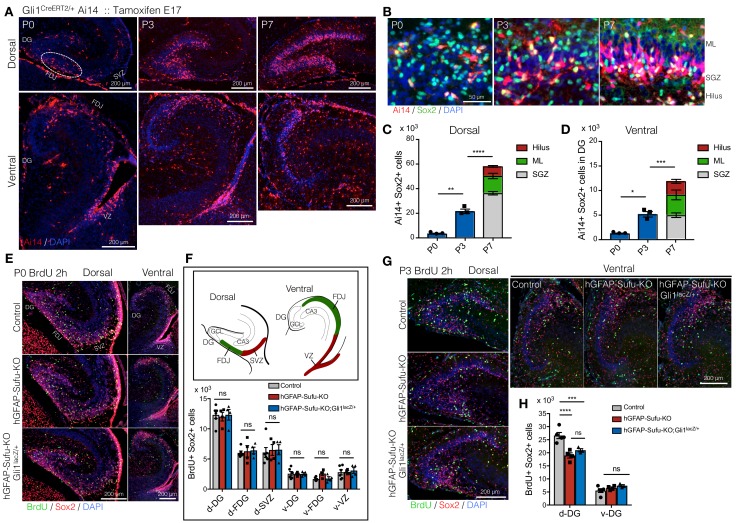
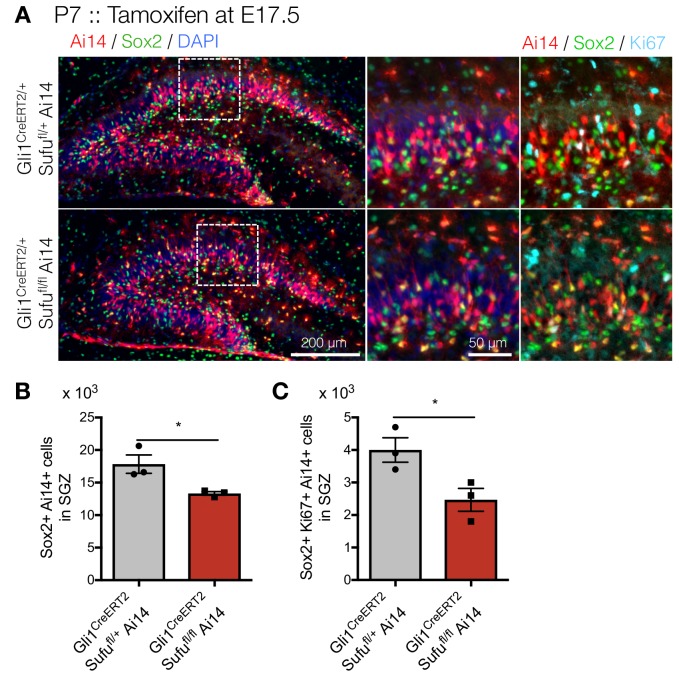
Figure 5. Long-lived NSCs expand in first postnatal week, and loss of Sufu impairs its expansion.
(A) Fate tracing of Hh-responding cells at E17.5 in postnatal DG development. Gli1CreERT2/+ Ai14 mice were treated with tamoxifen at E17.5 and Ai14 +Hh responding cells are analyzed in postnatal first week (P0-7). Representative immunofluorescence images for Ai14 (red) and DAPI (blue) in dorsal and ventral hippocampus in sagittal sections. Note that Hh-responding cells labeled by Ai14 at E17.5 sparsely appear in DGs at P0 and subsequently accumulate in SGZ. (B) Representative immunofluorescence images for Ai14 (red), Sox2 (green) and DAPI (blue) in SGZ. (C,D) Quantification of Ai14+/Sox2 +cells in dorsal (C) and ventral (D) DGs [n = 3 biological replicates per group]. The number of long-lived NSCs, indicated as Ai14+/Sox2 +cells, are increased in postnatal first week. (E) BrdU was injected at P0, and pups were sacrificed 2 hr later. Representative immunofluorescence images for BrdU (green), Sox2 (red) and DAPI (blue) in dorsal and ventral DGs of control, hGFAP-Sufu-KO and hGFAP-Sufu-KO;Gli1lacZ/+ mice. (F) Schematic illustration of the dorsal and ventral DG at P0. d: dorsal, v: ventral, FDJ: fimbriodentate junction; SVZ: subventricular zone. The bar graph indicates the number of Sox2+/BrdU +cells in each region [Control, n = 6; hGFAP-Sufu-KO, n = 4; hGFAP-Sufu-KO;Gli1lacZ/+, n = 4]. (G) BrdU was injected at P3, and pups were sacrificed 2 hr later. Representative immunofluorescence images for BrdU (green), Sox2 (red) and DAPI (blue) in dorsal and ventral DGs of control, hGFAP-Sufu-KO and hGFAP-Sufu-KO;Gli1lacZ/+ mice. (H) Quantification of Sox2+/BrdU +cells in dorsal and ventral DGs [Control, n = 5; hGFAP-Sufu-KO, n = 4; hGFAP-Sufu-KO;Gli1lacZ/+, n = 3]. Values represent mean ±SEM; ns: p>0.05, *p<0.05, **p<0.01, ***p<0.001, ****p<0.0001. ANOVA with Tukey post-hoc tests.


