. 2019 Apr 11;8:e42918. doi: 10.7554/eLife.42918

Figure 6. Deletion of Sufu prematurely induces the quiescent state transition.

(A) Schematic illustration for labeling NSCs that established quiescent state during DG development using two thymidine analogs. CldU is diluted when cell divides. Thus CldU amount goes down if the cell continuously proliferates during DG development. However, if the cell becomes quiescent state, CldU amount is maintained until adult then the cell can be double-labeled with CldU and IdU if the CldU-labeled quiescent cell starts proliferation and incorporate IdU at adult. (B) Experimental scheme of CldU and IdU injection. CldU was injected at P0, P3, P7 or P14, and then IdU was injected for 5 days at 8 weeks old. The mice were sacrificed at 3 days after last IdU injection. (C) Representative immunofluorescence images for CldU (green), IdU (red) and DAPI (blue) in the SGZ of animals injected CldU at different stages. White arrowheads indicate the CldU/IdU double-labeled cells. (D) Quantification of CldU+/IdU +cells in the SGZ [n = 3 biological replicates per group]. (E) Representative immunofluorescence images for CldU (green), IdU (red), DCX (cyan) and DAPI (blue) in the SGZ of animal injected CldU at P3. White arrowheads indicate the CldU+/IdU+/DCX + cells. (F) Quantification of CldU+/IdU+/DCX + cells in the SGZ [n = 3 biological replicates per group]. (G) Representative immunofluorescence images for CldU (green), IdU (red), DCX (cyan) and DAPI (blue) in the SGZ of control, hGFAP-Sufu-KO and hGFAP-Sufu-KO;Gli1lacZ/+ mice injected CldU at P0. White arrowheads indicate the CldU+/IdU+/DCX + cells. (H,I) Quantification of CldU+/IdU +cells (H) and CldU+/IdU+/DCX + cells (I) in the SGZ [P0 CldU: Control, n = 7; hGFAP-Sufu-KO, n = 4; hGFAP-Sufu-KO;Gli1lacZ/+, n = 6; P3 CldU: Control, n = 4; hGFAP-Sufu-KO, n = 5; hGFAP-Sufu-KO;Gli1lacZ/+, n = 3; P7 CldU: Control, n = 5; hGFAP-Sufu-KO, n = 5; hGFAP-Sufu-KO;Gli1lacZ/+, n = 4]. Values represent mean ±SEM; ns: p>0.05, *p<0.05, **p<0.01, ****p<0.0001. ANOVA with Tukey post-hoc tests.

Figure 6—source data 1 . Extended numerical data and statistical analysis for Figure 6.
DOI: 10.7554/eLife.42918.025

Figure 6.

Figure 6—figure supplement 1. Deletion of Sufu prematurely induces the quiescent state transition.

Figure 6—figure supplement 1.

(A) Representative immunofluorescence images for CldU (green), Sox2 (red), GFAP (cyan) and DAPI (blue) in the SGZ of animals injected CldU at different stages. White arrowheads indicate the CldU+/Sox2+/GFAP +radial NSCs. (F) Quantification of CldU+/Sox2+/GFAP +radial NSCs in the SGZ [P0 CldU: Control, n = 7; hGFAP-Sufu-KO, n = 4; hGFAP-Sufu-KO;Gli1lacZ/+, n = 7; P3 CldU: Control, n = 4; hGFAP-Sufu-KO, n = 5; hGFAP-Sufu-KO;Gli1lacZ/+, n = 3; P7 CldU: Control, n = 5; hGFAP-Sufu-KO, n = 5; hGFAP-Sufu-KO;Gli1lacZ/+, n = 4]. Values represent mean ±SEM; ns: p>0.05, *p<0.05, **p<0.01, ****p<0.0001. ANOVA with Tukey post-hoc tests.
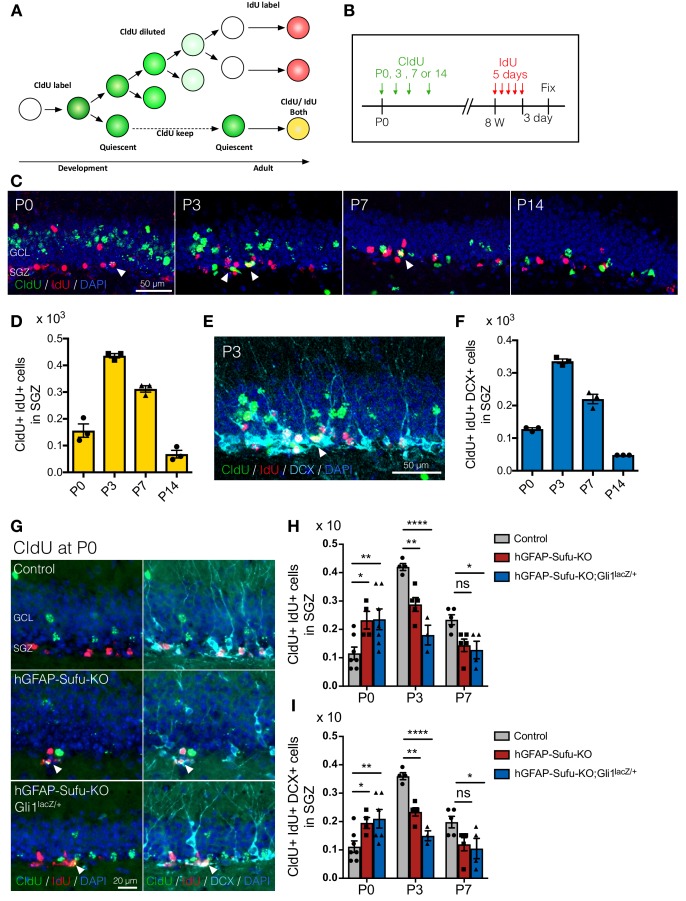
Figure 6—figure supplement 1—source data 1. Extended numerical data and statistical analysis for Figure 6—figure supplement 1.
DOI: 10.7554/eLife.42918.026
Figure 6—figure supplement 2. Deletion of Sufu prematurely decreases the proliferation of NSCs during DG development.

Figure 6—figure supplement 2.

(A) Representative immunofluorescence images of Sox2 (red) and Ki67 (green) in the dorsal and ventral DG of control, hGFAP-Sufu-KO and hGFAP-Sufu-KO;Gli1lacZ/+ mice at P0. DNA is stained with DAPI (blue). d: dorsal, v: ventral, FDJ: fimbriodentate junction; SVZ: subventricular zone. (B) The bar graph indicates the ratio of Ki67 +cells to Sox2 +NSCs in DGs [Control, n = 5; hGFAP-Sufu-KO, n = 4; hGFAP-Sufu-KO;Gli1lacZ/+, n = 3]. (C) Representative immunofluorescence images of Sox2 (red) and Ki67 (green) in SGZ of control, hGFAP-Sufu-KO and hGFAP-Sufu-KO;Gli1lacZ/+ mice at P3 and P7. (D) The bar graph indicates the ratio of Ki67 +cells to Sox2 +NSCs in DGs [P3: Control, n = 4; hGFAP-Sufu-KO, n = 4; hGFAP-Sufu-KO;Gli1lacZ/+, n = 3; P7: Control, n = 8; hGFAP-Sufu-KO, n = 7; hGFAP-Sufu-KO;Gli1lacZ/+, n = 5]. Values represent mean ±SEM; ns: p>0.05, *p<0.05, ***p<0.001. ANOVA with Tukey post-hoc tests.
Figure 6—figure supplement 2—source data 1. Extended numerical data and statistical analysis for Figure 6—figure supplement 2.
DOI: 10.7554/eLife.42918.027