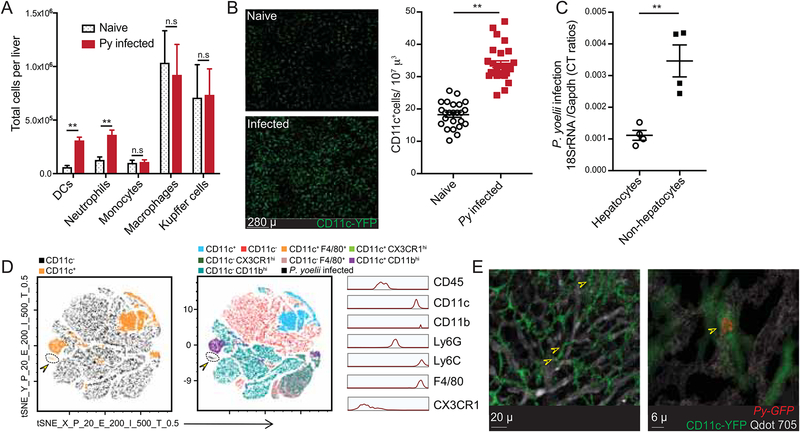
Figure 1: CD11c+ cells are recruited to liver after Plasmodium infection and harbor parasites.
(A) Total number of indicated myeloid cell populations in naïve or 36h Py infected livers of B6 mice.
(B) Left panels are representative, pseudo-colored multiphoton live-microscopy images showing CD11c+ DCs in naïve or 36h Py infected B6.CD11c-YFP livers. Panel on the right summarizes the density of CD11c+ cells. Each dot represents a microscopic field.
(C) Relative parasite loads in the hepatocyte and non-hepatocyte fractions from 36–44h Py infected B6 mice livers. Each dot represents one mouse.
(D) t-SNE plot displaying the clustering and distribution of indicated myeloid cell populations in Py-GFP infected B6 mice livers. Data analyzed by flow-cytometry and concatenated from >2x10⁵ non-hepatocytes, gated on CD45+ cells. Colors correspond to automated clustering of distinct cell populations based on the indicated markers, in the left and middle panels. Portion of the maps identified with arrowhead indicates Py-GFP distribution. Panel on the right indicates relative expression of the designated markers in Py-GFP+ CD45+ cells in the liver.
(E) Representative, pseudo-colored multiphoton live-microscopy images showing hepatic CD11c+ cells (green) containing Py-GFP (red) in B6.CD11c-YFP mice; indicated by arrows. Qdot 705 staining (white) indicates hepatic sinusoids. All data depict one of 2–5 independent experiments, with at least 3 mice or samples/group, and are presented as mean± s.e.m. Statistical analyses with t-tests with Welch corrections. (*) p ≤ 0.05, (**) p ≤ 0.01, (n.s) p > 0.05.

