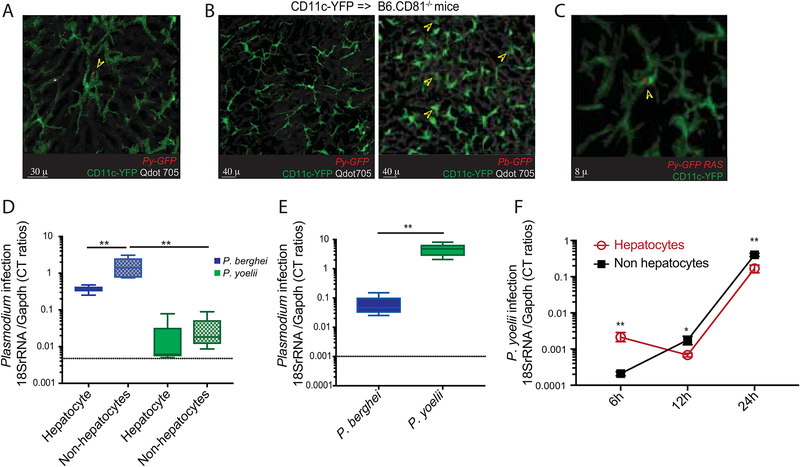
Figure 2: Hepatocyte infection is a prerequisite for CD11c+ cells harboring Plasmodium in liver-stage malaria.
(A) Representative, pseudo-colored multiphoton live-microscopy image showing 42h Py-GFP mosquito bite infected liver of B6.CD11c-YFP mice. Arrowhead marks CD11c+ cells harboring Py-GFP (see movies S1, S2).
(B) Representative, pseudo-colored multiphoton live-microscopy images showing livers of CD11c-YFP=>B6.CD81−/− bone marrow chimeric mice 42h p.i with Py-GFP (left) or Pb-GFP (right) spz. Qdot705 staining indicates hepatic sinusoids. Arrowheads in the right panel indicate CD11c+ cells harboring Pb-GFP. Data represents one of at least 10 separate areas imaged in 3 separate mice.
(C) Representative, pseudo-colored multiphoton live-microscopy image showing 42h Py-GFP RAS infected liver of B6.CD11c-YFP mice. Arrowhead marks CD11c+ cells harboring Py-GFP.
(D) Relative parasite loads in the hepatocyte and non-hepatocyte fractions from livers at 42h p.i. of CD11c-YFP=>B6.CD81−/− bone marrow chimeric mice co-inoculated with Pb and Py, detected with corresponding species-specific primers. Data represent 2 replicate experiments representing the range of data distribution with the error bars indicating the range and midline representing median of distribution based on ANOVA.
(E) Relative parasite loads in the hepatocyte fractions from livers at 42h p.i. of B6 mice co-inoculated with Pb and Py, detected with corresponding species-specific primers. Data represent 3 replicates representing the range of data distribution with the error bars indicating the range and midline representing median of distribution based on 2-tailed t-test.
(F) Relative parasite loads in the hepatocyte and non-hepatocyte fractions from Py infected B6 mice livers, at the indicated times p.i. (x-axis). Data from 3 separate experiments with 5 mice/group, and presented as mean± s.e.m. Groups compared at each time-point by 2-tailed t-tests. (*) p ≤ 0.05, (**) p ≤ 0.01.

