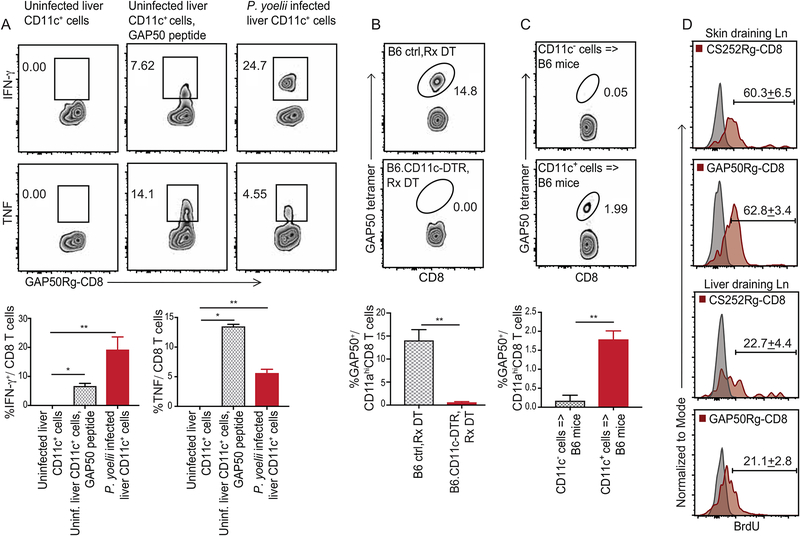
Figure 3: CD11c+ cells from Plasmodium infected liver and liver draining lymph nodes prime CD8 T cell responses in mice.
(A) Representative flow plots indicating the frequencies of IFNγ (top row) or TNF (bottom row) producing GAP50Rg-CD8 T cells after co-incubation with hepatic CD11c+ DCs from uninfected mice (left), uninfected mice +GAP50 peptide (middle) or Py infected B6 mice (right).
(B) Representative flow plots indicating frequencies of GAP50 tetramer+ CD8 T cells (blood, 5d p.i.) in Py-RAS infected B6 (top) and B6.CD11c-DTR (bottom) mice treated with diphtheria toxin (DT, −1d, +2d p.i.).
(C) Representative flow plots depicting frequencies of GAP50 tetramer+ CD8 T cells (blood, 5d p.i.) in B6 mice that received hepatic CD11c− (2x10⁶, top) or CD11c+ (2x10⁵, bottom) cells from 36h p.i. Py infected B6 donors. (A-C) Bottom row: Bar graphs summarizes data as mean ± s.e.m, analyzed using 1-way ANOVA with Holm-Sidak correction (A) or two-tailed t-tests (B,C). (*) p ≤ 0.05, (**) p ≤ 0.01.
(D) Representative histograms indicating BrdU incorporation at 5d p.i. in adoptively transferred CS252Rg-CD8+ T cells or GAP50Rg-CD8+ T cells, in popliteal or liver-draining lymph nodes of FTY720-treated CB6F1 recipient mice inoculated in foot-pad with Pb-RAS; numbers represent mean ± s.e.m. Grey histograms are isotype controls. Data represent one of at least 3 separate experiments, with at least 3 mice per group.

