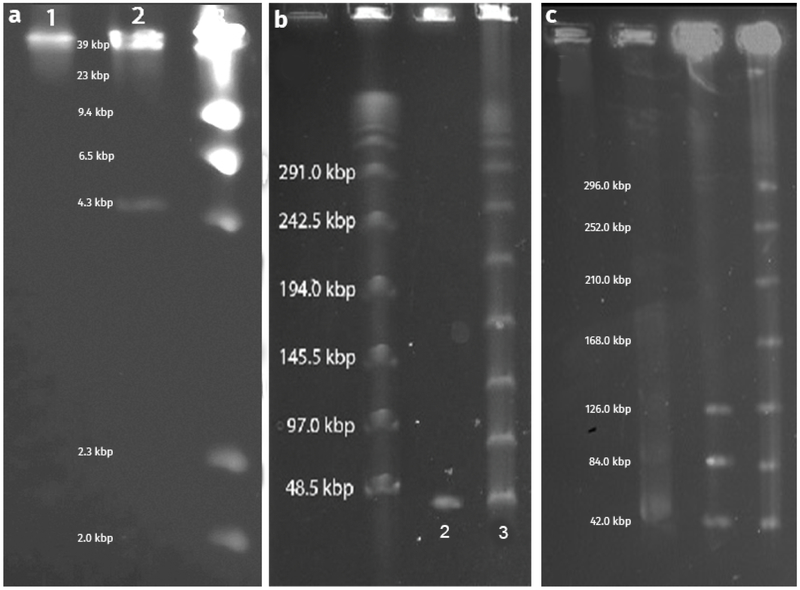
Figure 5.
PFGE images depicting SacII digested Kronos DNA and undigested DNA. Image (A) represents Kronos DNA digested with SacII. Lane 1 depicts digested DNA that has not been heated, and lane 2 depicts DNA that has been heated (>70°C). Lane 3 is λ DNA digested with HinDIII. Image (B) represents Kronos DNA that has been heated to denature the cos ends (lane 2) and Kronos DNA that has not been heated, leaving the cos ends annealed (lane 3). The λ ladder is appropriately labeled to illustrate relative band sizes. Image (C) illustrates the concentration dependency for concatemer formation of Kronos DNA. DNA concentration is increasing from left to right (~0.05 μg/μl to ~0.40 μg/μl).

