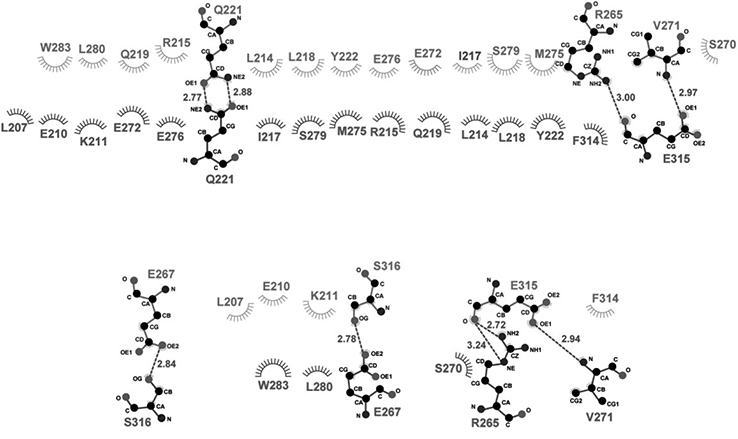
Figure 4. Ligplot presentation of molecular interactions in the dimerization interface.

Hydrogen bonds are designated with green dashed lines (the distance between the two heavy atoms is indicated by a number in angstrom). Hydrophobic interactions are represented as starbursts.
