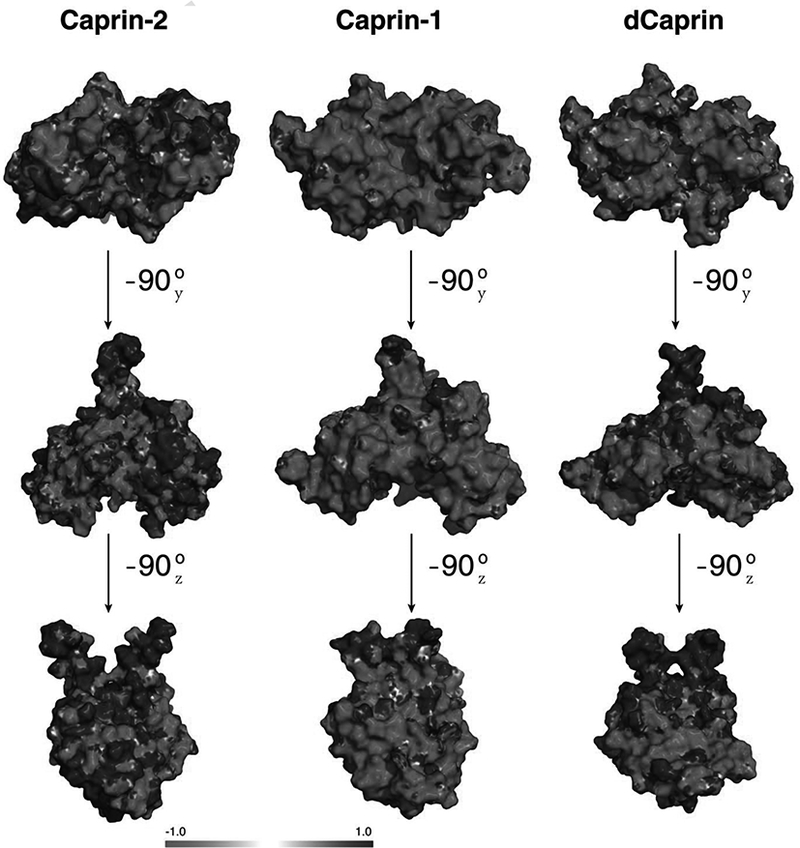
Figure 5. Electrostatic surface representation of Caprin homodimeric structures (for Caprin-2 and Caprin-1) and a structural model (for dCaprin).

Blue and red represent regions of positive and negative potentials respectively.

Blue and red represent regions of positive and negative potentials respectively.