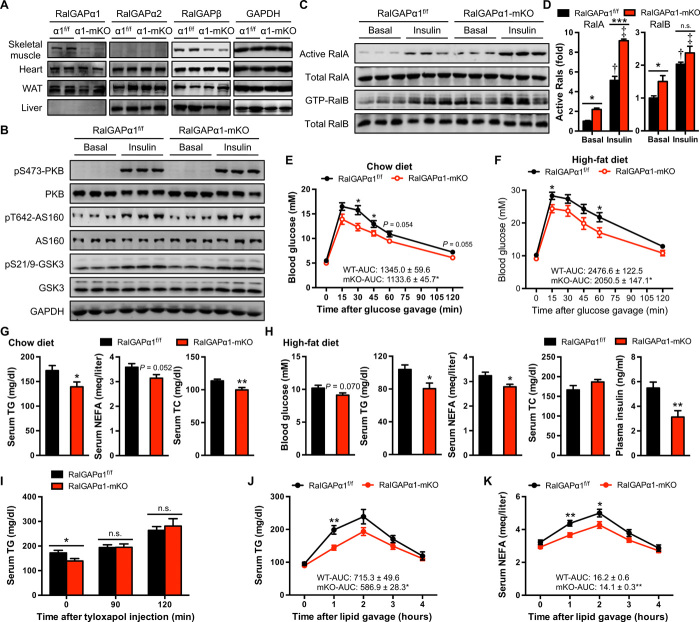
Fig. 4. Metabolic phenotype of RalGAPα1-mKO mice.
(A) Expression of RalGAPα1, RalGAPα2, and RalGAPβ in tissues of male RalGAPα1-mKO mice (3 months old). The gastrocnemius muscle was analyzed. (B) Expression and phosphorylation of PKB and its substrates AS160 and GSK3 in the gastrocnemius muscle of male RalGAPα1-mKO mice (3 months old) in response to insulin. (C) GTP-bound active RalA and RalB in the gastrocnemius muscle of male RalGAPα1-mKO mice (3 months old) in response to insulin. (D) Quantitation of active RalA and RalB in the blots shown in (C). n = 3. †P < 0.001 (RalA) or P < 0.001 (RalB) (RalGAPα1f/f insulin versus RalGAPα1f/f basal). ‡P < 0.001 (RalA) or P < 0.01 (RalB) (RalGAPα1-mKO insulin versus RalGAPα1-mKO basal). (E) Oral glucose tolerance test in RalGAPα1f/f and RalGAPα1-mKO male mice fed on a chow diet at the age of 5 months. The values show the glucose area under the curve during glucose tolerance test. n = 7 to 8. (F) Oral glucose tolerance test in RalGAPα1f/f and RalGAPα1-mKO male mice fed on HFD at the age of 14 weeks. The values show the glucose area under the curve during glucose tolerance test. n = 7. (G) Serum TG, NEFA, and TC in overnight-fasted RalGAPα1f/f and RalGAPα1-mKO male mice fed on a chow diet at the age of 4 months. n = 7. (H) Serum TG, NEFA, TC, and insulin in overnight-fasted RalGAPα1f/f and RalGAPα1-mKO male mice fed on HFD at the age of 4 months. n = 7 to 8. (I) Serum TG levels in overnight-fasted RalGAPα1f/f and RalGAPα1-mKO male mice upon administration of tyloxapol via intraperitoneal injection. n = 7. (J and K) Serum TG (J) and NEFA (K) levels after lipid administration via oral gavage in RalGAPα1f/f and RalGAPα1-mKO male mice at the age of 3 to 4 months. The values show the area under the curve during lipid tolerance test. n = 7 to 8. Data are given as means ± SEM. *P < 0.05, **P < 0.01, and ***P < 0.001.

