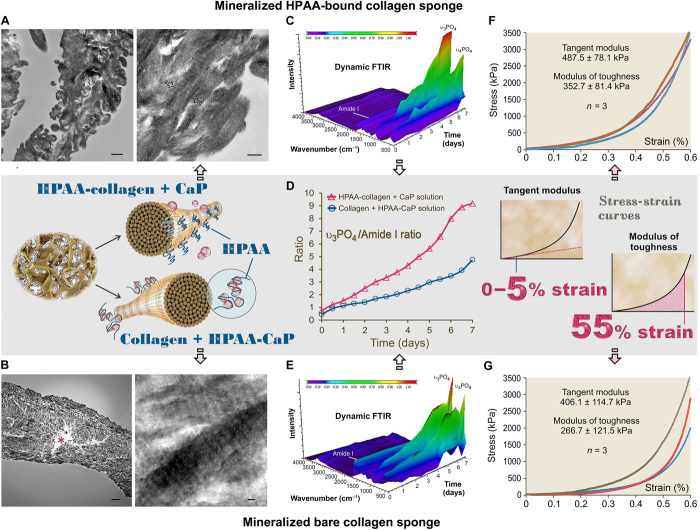
Fig. 5. Characterization of mineralized HPAA-collagen sponges and bare collagen sponges.
(A) TEM of mineralized HPAA-collagen sponges. Left: Dense mineralization in collagen leaflets cross-linked with HPAA and immersed in CaP solution for 7 days (left inset, middle row). Scale bar, 500 nm. Right: Collagen fibrils within leaflet were filled with apatite crystallites oriented along the longitudinal axis of the fibril (between open arrows). Scale bar, 200 nm. (B) TEM of mineralized bare collagen sponges. Left: Heavily mineralized collagen leaflet after immersion in HPAA-CaP solution for 7 days. Nevertheless, the central part of the leaflet was not mineralized (asterisk). Scale bar, 2 μm. Right: Intrafibrillar apatite crystallites arranged along the longitudinal axis of the fibrils. Scale bar, 50 nm. (C) Dynamic attenuated total reflection (ATR)–FTIR shows progressive mineralization of an HPAA-collagen sponge at 12-hour intervals over a 7-day period. Spectra were normalized along the collagen amide I peak (~1640 cm−1). (D) Changes in apatite υ3PO4/collagen amide I ratio of mineralized anionic collagen sponges and unmodified collagen sponges. Compared to bare collagen sponges mineralized in HPAA-CaP solution, HPAA-collagen sponges mineralized in CaP solution demonstrated increases in both the mineralization rate (slope of curves) and extent of mineralization. (E) Dynamic ATR-FTIR shows the progress of mineralization of a bare collagen sponge in HPAA-CaP solution. (F) Stress-strain response of mineralized HPAA-collagen sponges for determining tangent modulus and modulus of toughness (right inset, middle row). (G) Stress-strain response of mineralized bare collagen sponges.

