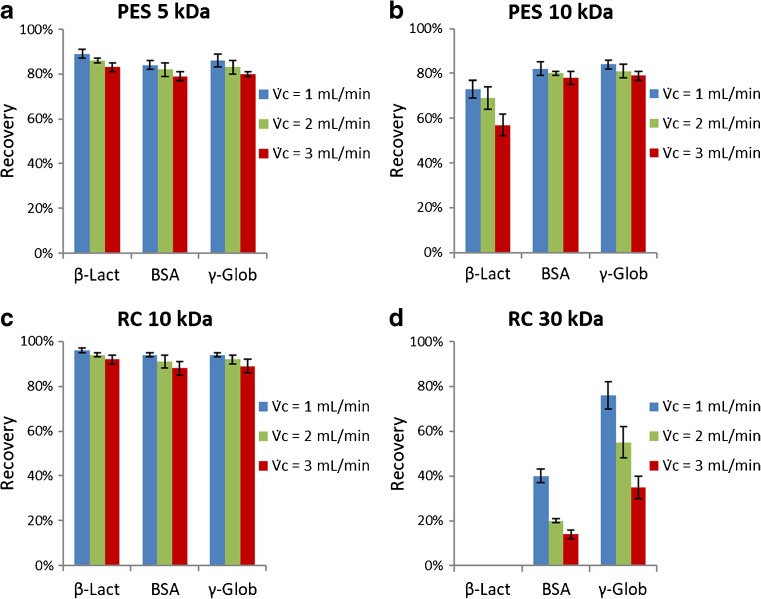
Fig. 4.
a–d Protein recovery of β-lactoglobulin (36.7 kDa), BSA (66.5 kDa), and γ-globulin (150 kDa) estimated with different UF membranes and cross-flow rates; = 0.8 mL/min for RC and = 1.2 mL/min for PES membranes. The error bars represent the membrane-to-membrane variation and are given at 1σ level (± σ)

