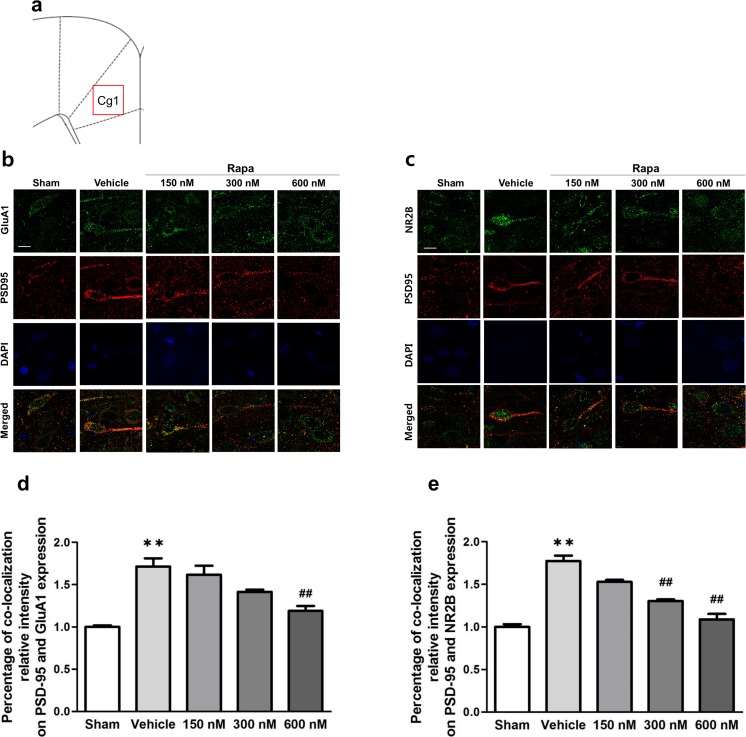
Fig. 5.
Synaptic protein expression after inhibition of mTOR signaling in the ACC. a Location of the ACC used for staining analysis. Cg1 indicates cingulate cortex, area 1 in the rat brain atlas and red squire indicates location for staining analysis. b Different sets of ACC tissue treated with rapamycin (Rapa) or vehicle on POD 7 were subjected to immunofluorescence staining with anti-PSD-95 (red), anti-GluA1 (green) or anti-NR2B (green), and DAPI (blue). Representative immunofluorescence staining of PSD-95, AMPA receptor GluA1 subunit, and nuclei (DAPI). c Representative immunofluorescence staining of PSD-95, NMDA receptor NR2B subunit, and nuclei (DAPI). Scale bar = 10 μm. d Percentage of co-localization relative intensity of PSD-95 and AMPA GluA1 receptor subunit expression. The percentage was significantly higher in the vehicle group than in the Sham group, and the percentages in the Rapa groups declined in a dose-dependent manner. The 600-nM group showed a significant decrease compared with the vehicle group. e Percentage of co-localization relative intensity of PSD-95 and NMDA NR2B receptor subunit expression. The percentage was significantly higher in the vehicle group than in the Sham group, and the percentages in the Rapa groups declined in a dose-dependent manner. The 300- and 600-nM groups showed significant decreases compared with the vehicle group. Data are presented as mean ± SEM. **p < 0.01 vs. Sham; ##p < 0.01 vs. vehicle, one-way ANOVA followed by Tukey’s multiple comparison test

