Figure 2.
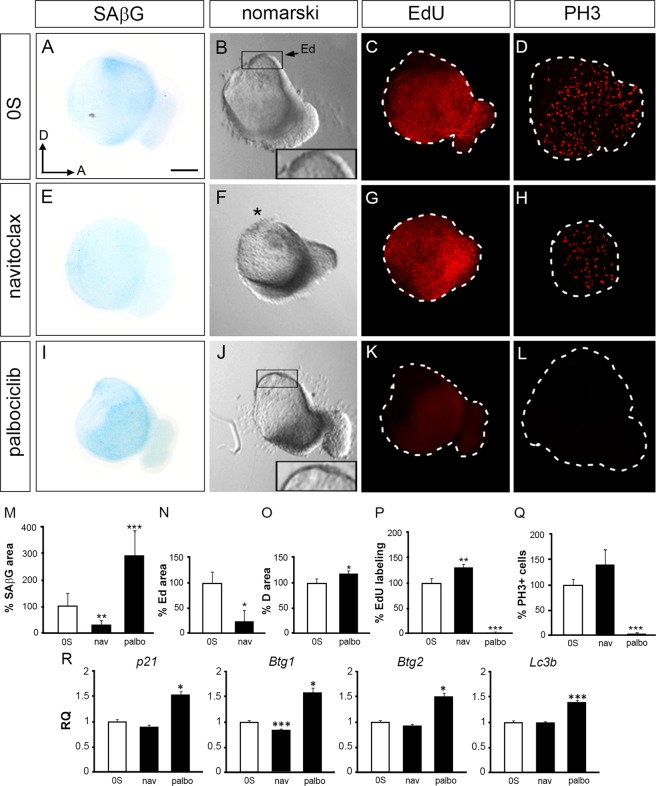
Senescence modulation disrupts early inner ear development. Otic vesicles were isolated from HH18 chicken embryos and cultured ex vivo for 20 h in serum free medium (0S) (A–D), in the presence of navitoclax (1 µM, E–H) or palbociclib (1 µM, I–L). SAβG staining in the otic epithelium of chicken embryos reveals the modulation of senescence levels (A,E,I), quantification in (M) data are represented as SAβG mean area ± SEM with respect to the otic vesicle area, normalized to the 0S condition. The statistical significance was determined by Student’s t-test: **P < 0.01, ***P < 0.005 versus control condition (0S, white bars). Light microscopy images are shown to visualise morphology (B,F,J). Navitoclax-treated otic vesicles showed reduction of the endolymphatic duct area (F, asterisk, quantification in N); note the expanded and thinned otocyst dorsal region caused by the palbociclib treatment in comparison with the control condition (B,J, insets; quantifications in O). Proliferation was measured by EdU incorporation (red; C,G,K, quantification in P) and by immunostaining for the mitotic marker phospho-Histone-3, PH3 (red; D,H,L, quantification in Q). Representative images from optical or compiled confocal microscopy are shown from at least six otic vesicles per condition studied, in at least three independent experiments. Quantification for areas and inmunostainings were measured as described in Materials and Methods. Data are shown as the mean ± SEM and the statistical significance was determined by Student’s t-test: *P < 0.05, **P < 0.01, ***P < 0.005 versus control condition (0S, white bars). Scale bar, 150 µm. (R) p21, Btg1, Btg2 and Lc3b mRNA expression levels were measured by RT-qPCR in isolated HH18 otic vesicles cultured for 20 h. Gene expression was calculated as 2−ΔΔCt and normalized to the levels of the control condition (0S, white bars). The results are expressed as the mean ± SEM from three independent experiments performed in triplicate. Statistical significance was determined with the Student’s t-test: *P < 0.05, ***P < 0.005, versus 0S. Ed, endolymphatic duct; Orientation: A, anterior; D, dorsal.

