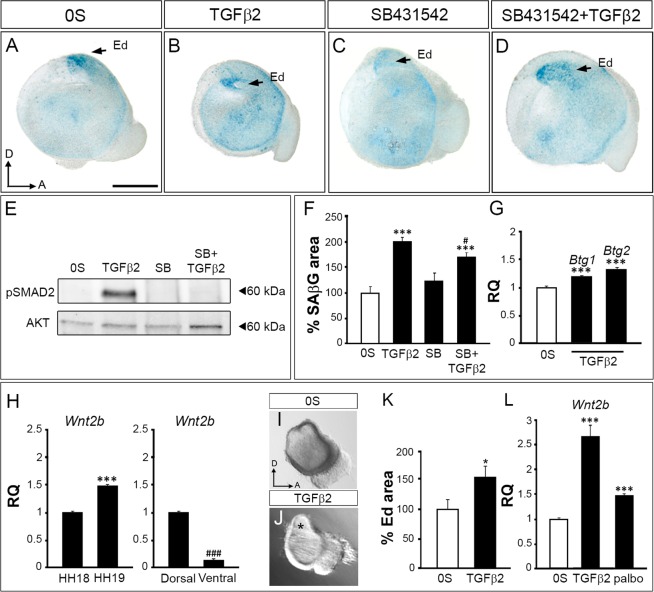
Figure 4.
TGFβ pathway induction of senescence in the otocyst. (A–D) SAβG staining in isolated otic vesicles from stage HH18 embryos cultured ex vivo for 20 h in free serum medium (0S), in the presence of TGFβ2 (10 ng/ml), SB (SB431542; 10 µM) or a combination of both. (E) Levels of pSMAD2 were measured by western blotting of explanted otic vesicle lysates (two independent experiments). (F) SAβG staining quantification is shown as mean SAβG area ± SEM with respect to the total area, normalized to the 0S condition (white bar). ***p < 0.001 vs 0S; #p < 0.05 vs SB. (G) Btg1 and Btg2 mRNA expression levels were measured by RT-qPCR in cultured otic vesicles. Statistical significance was determined with the Student’s t-test: ***P < 0.005, versus 0S. (H) Wnt2b mRNA expression levels were measured by RT-qPCR in non-cultured HH18 and HH19 otic vesicles and in dissected dorsal and ventral regions from HH19 otic vesicles. Statistical significance was determined with the Student’s t-test: ***P < 0.005, versus HH18; ###P < 0.005, versus HH19 dorsal regions. (I,J) Light microscopy images from TGFβ2-treated otic vesicles showing the relative increment of the endolymphatic duct area (J, asterisk, quantification in K). Quantification for areas were measured and are shown as the mean ± SEM and the statistical significance was determined by Student’s t-test: *P < 0.05, versus control condition (0S, white bars). (L) Wnt2b mRNA levels were measured by RT-qPCR in cultured otic vesicles in 0S medium, in presence of TGFβ2 (10 ng/ml) or palbociclib (1 µM). Statistical significance was determined with the Student’s t-test: ***P < 0.005, versus 0S. Gene expression was calculated as 2−ΔΔCt and normalized to the levels of 0S (white bars). The results are expressed as the mean ± SEM (three independent experiments performed in triplicate). Ed, endolymphatic duct. Orientation: A, anterior; D, dorsal. Scale bar: 150 μm.

