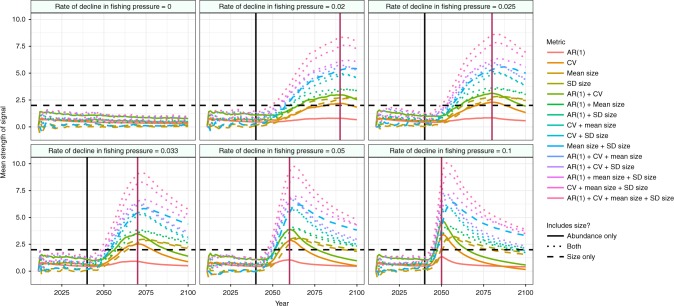
Fig. 3.
Mean trends in the strength of EWSR compromised of trait and abundance signals across 300 simulations of each rate of decline in fishing pressure. Those metrics that include size and abundance-based measures of stability (dotted lines) had significantly stronger signals of recovery than those based on either size (dashed lines) or abundance (solid lines) alone. Horizontal black lines indicate a 2σ threshold where a warning signal is considered as present under the method proposed by Drake & Griffen14. Vertical black lines indicate the point in time where fishing pressures begin to decline, vertical red lines show the point at which fishing pressures had fallen to 0

