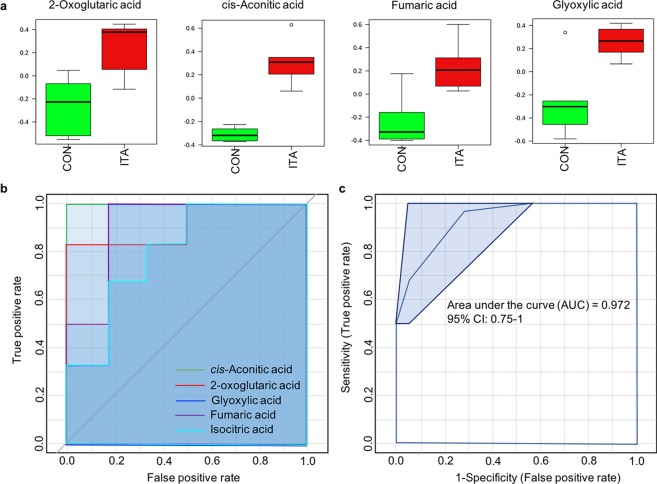
Figure 3.
Effects of ITA on glyoxylate shunt of Vibrio sp. cultured in LB media with and without ITA. (a) Altered metabolites of glyoxylate shunt identified by t-test (p < 0.05). Box plots show relative abundances of metabolites after normalization (b) Univariate ROC curve analysis of significantly altered metabolites (ITA/Non ITA) of the glyoxylate shunt. (c) Multivariate ROC curve-based model evaluation of all altered metabolites in the glyoxylate shunt identified by ROC curve analysis.

