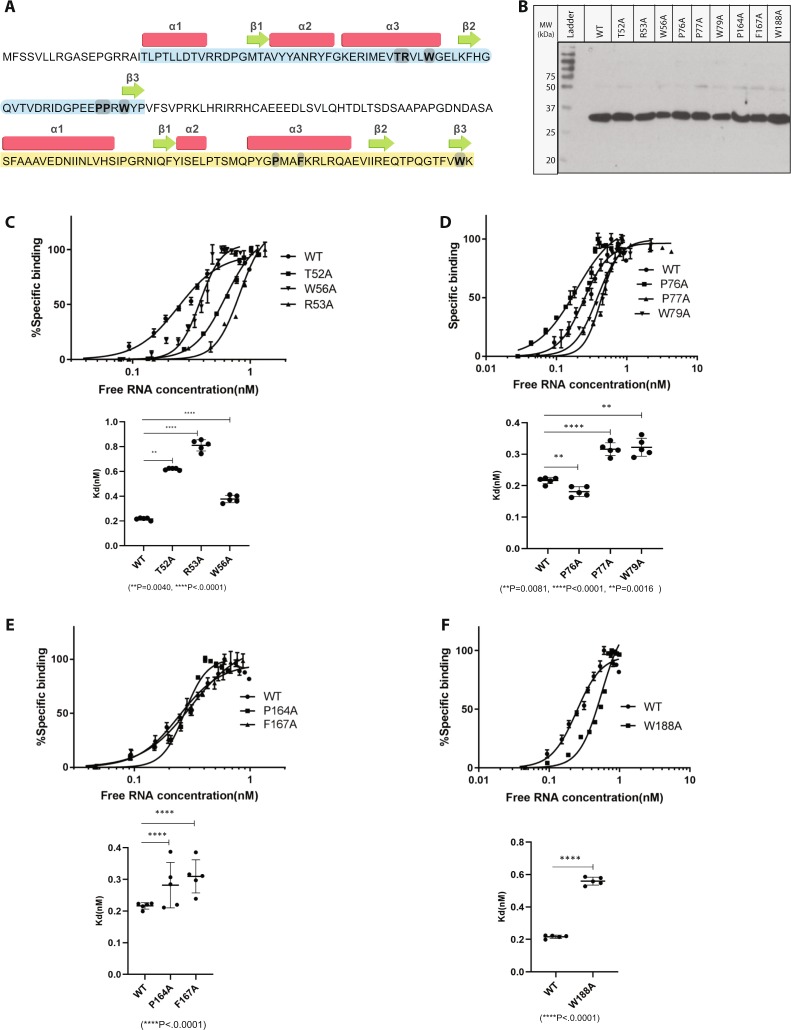
Figure 5.
gA6[14] RNA-binding activities of RBP7910 point mutations measured by gel shift mobility analysis. (A) The complete amino acid sequence of RBP7910 is shown with the predicted N- and C-terminal ZBDs in blue and yellow, respectively. The α-helices and β-strands of the predicted RNA recognition core in ZBDs are represented by boxes and by arrows, respectively. The point mutations used in this study are in bold and shaded. (B) Purified, recombinant his-tagged WT RBP7910 and mutant proteins were analyzed by 12% SDS-PAGE. The molecular weight marker is shown on left side. Binding activities of point mutations selected from the α3 (C) and wing region (D) of the predicted ZαRBP7910, and the α3 (E) and wing region (F) of the predicted ZβRBP7910. Binding activities of mutants from each region were quantified using a nonlinear curve fitting method, as it was done previously for the WT RBP7910. Kd values of each point mutation were calculated and compared to the Kd of WT RBP7910. Data are presented as mean ± SD unpaired two-tailed t-test.

