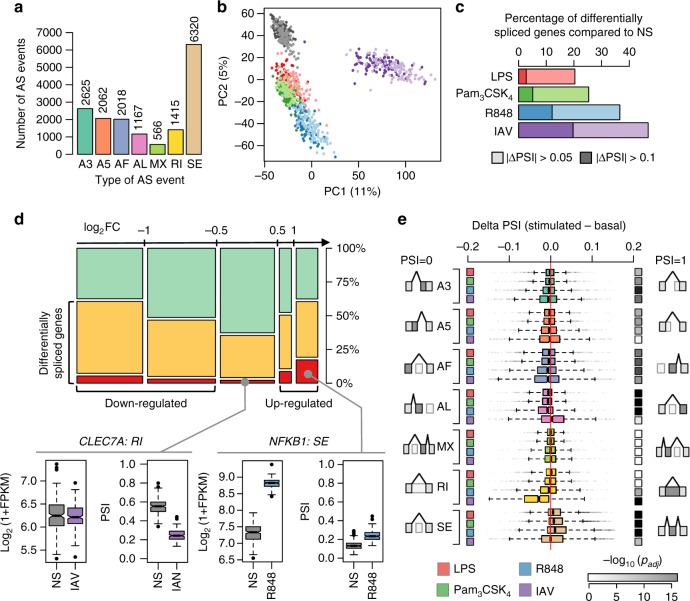
Fig. 2.
Immune stimulation induces major shifts in alternative splicing (AS) patterns. a Number of detected AS events by type: A3, alternative 3′ splice site; A5, alternative 5′ splice site; AF, alternative first exon; AL, alternative last exon; MX, mutually exclusive exons; RI, retained intron; SE, skipped exon. Each type of AS event is presented in a different colour that is consistently used across all figures. b Principal components analysis of AS events in different conditions: non-stimulated (grey), and activated with LPS (red), Pam3CSK4 (green), R848 (blue) and IAV (purple). Light and dark shades represent European and African individuals, respectively. The same colour code is used for conditions, across all figures. c Percentage of differentially spliced genes across conditions. d Percentage of genes differentially spliced after stimulation (in at least one condition), according to maximal fold-change in gene expression upon stimulation (log2FC). Non-differentially spliced genes are shown in green, and differentially spliced genes in orange. Among the latter, immune response genes, as defined by GO, are highlighted in red. Levels of genes expression—log2(1 + FPKM)—and alternative splicing—PSI—are shown for two immune genes, CLEC7A and NFKB1, at the basal state and in the stimulation condition where the changes in isoform usage are the most pronounced (centre line, median; box limits, upper and lower quartiles; whiskers, 1.5× interquartile range; points, outliers). Boxplots are coloured according to the condition of stimulation. e Boxplots showing the shifts in PSI values, for each type of AS event and stimulus (boxplots drawn as previously). The nature of the stimuli is indicated on the left-hand side by coloured squares and significance is indicated on the right-hand side by grey squares (darker for increased significance). Boxplots are coloured according to the type of AS event considered. Source data are provided as a Source Data file

