Fig. 3.
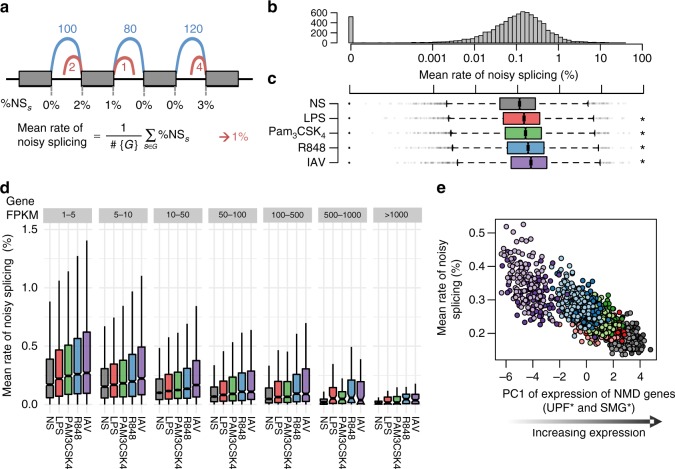
Increase in noisy splicing upon immune stimulation. a For each constitutive splice site neighbouring a coding exon, functional splicing events (blue) that join two exons are distinguished from non-functional splicing events (red) where the splice site is joined with a cryptic, non-conserved splice site (GerpRS < 2). For each gene, the mean rate of noisy splicing was computed as the average across all constitutive splice sites of the frequency at which non-functional splicing events occur. b Distribution of the rate of noisy splicing at the basal state. c Distribution of the levels of noisy splicing per gene according to the condition of stimulation (centre line, median; box limits, upper and lower quartiles; whiskers, 1.5× interquartile range; points, outliers). The significance of differences between noisy splicing in each stimulation condition and the basal state was assessed by a Wilcoxon rank test (*p < 10−20). d Distribution of the rate of noisy splicing per gene as a function of gene expression. For each bin of expression, the rate of noisy splicing is shown across all conditions of stimulation (boxplots drawn as previously). e Average rate of noisy splicing per sample correlates with expression of nonsense-mediated decay genes (first PC). For each sample, the colour reflects the condition of stimulation (grey: NS, red: LPS, green: Pam3CSK4, blue: R848, purple: IAV). Light and dark shades indicate European and African individuals respectively. Source data are provided as a Source Data file

