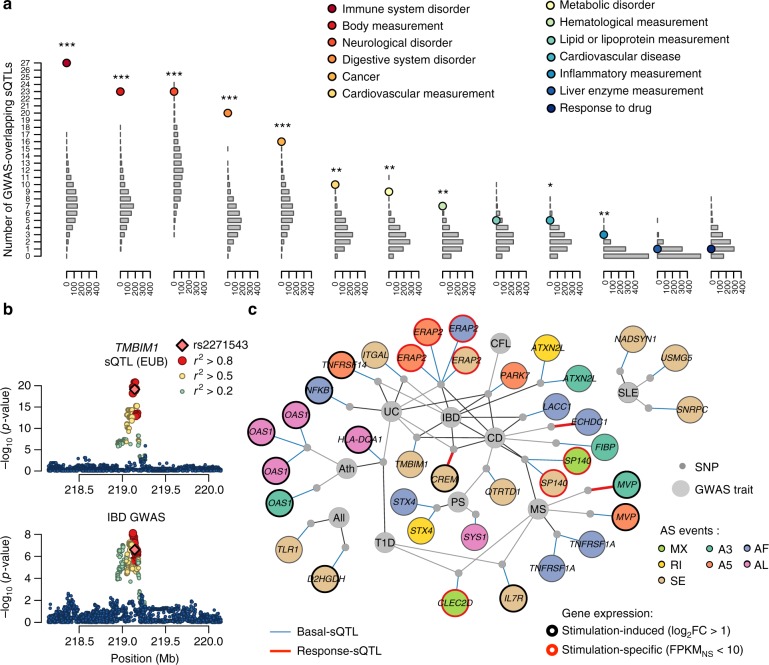
Fig. 5.
Innate immunity sQTLs contribute to complex traits and immune disorders. a Enrichment of sQTLs in GWAS hits. For each trait/disease category, coloured dots show the number of sQTLs overlapping a GWAS locus. Grey bars represent the distribution of the expected number of GWAS hits when resampling 1000 random SNPs matched for minor allele frequency (resampling p-value, *p < 0.05, **p < 0.01, ***p < 0.001). b Log10(p-value) profiles of the TMBIM1 sQTL (upper panel) and GWAS for inflammatory bowel disease (IBD, lower panel). SNPs are coloured according to their LD (r2) with the sQTL peak SNP and putative causal variant rs2271543. Only SNPs where both sQTLs and GWAS summary statistics were available are shown. c sQTLs colocalizing with GWAS loci for 10 major immune-related disorders (grey nodes, Ath asthma, All allergy, CEL celiac disease, CD Crohn’s disease, IBD inflammatory bowel disease, MS multiple sclerosis, PS psoriasis, SLE systemic lupus erythematous, T1D type-1 diabetes, UC ulcerative colitis). For each sQTL, genetic variants are represented by grey dots and are linked to the associated AS event (coloured nodes, named after their associated gene). AS events are coloured by class of event and circled according to gene expression patterns upon stimulation (black: upregulated—log2FC > 1 in at least one condition, red: specific to stimulation—FPKM < 10 at basal state and log2FC > 1). Links between AS events and sQTLs indicate stimulation-specificity of the genetic association (blue edge for sQTLs, red for response sQTLs—p-value > 0.001 at basal state and prsQTL < 0.01). Links between sQTLs and GWAS traits indicate colocalization (r2 > 0.8 between sQTLs and GWAS SNPs in Europeans) and are coloured according to the strength of the GWAS association (grey: GWAS p < 10−5, black: GWAS p < 10−8). Source data are provided as a Source Data file

