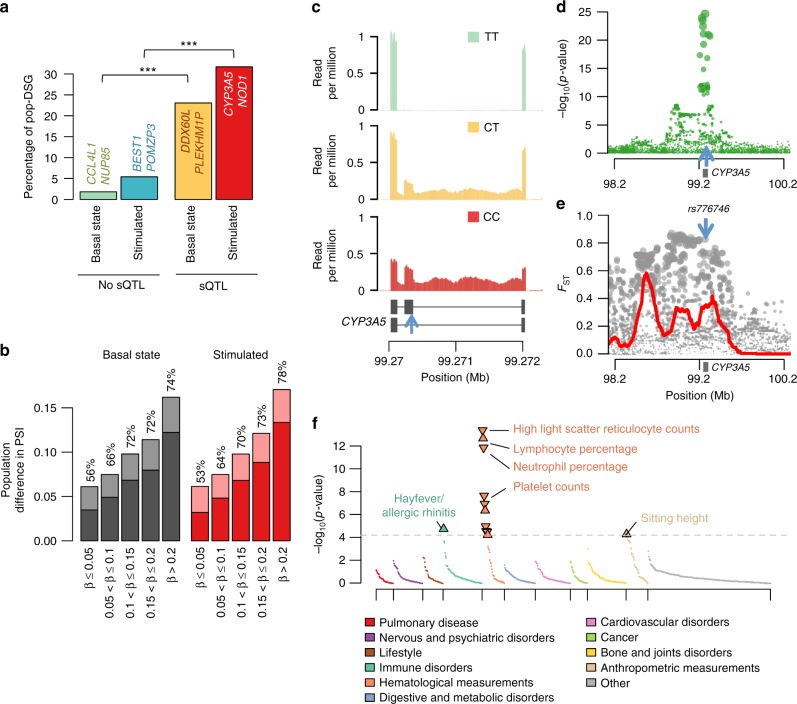
Fig. 6.
Population differences in alternative splicing and impact of positive selection. a Percentage of genes showing differential splicing between populations (pop-DSG) at the basal state and after stimulation, classified according to the presence of a sQTL (Fisher’s exact test for equal proportion, ***p < 10−20). For each group, examples of genes that present the strongest population differences are reported. For the stimulated state, the reported genes are chosen among those that are differentially spliced specifically after stimulation. b Contribution of genetic factors to the detected population differences in splicing patterns. The mean difference in PSI value between populations is represented, at the basal state (grey) and after stimulation (red), for genes presenting an sQTL with various levels of effect size (β). For each group, the average difference in PSI value that is mediated by the sQTL is shown in dark shade, and the corresponding percentage is indicated above the bar. c The derived allele (C) of the sQTL rs776746 (blue arrow) is associated with the inclusion of an additional exon at the CYP3A5 gene. d Association between SNPs in a 2 Mb window around the sQTL rs776746 and splicing levels of CYP3A5 in the Pam3CSK4 condition. e Signals of positive selection around the CYP3A5 locus, measured by the FST metric. The red curve shows the proportion of SNPs with extreme FST values (>95% percentile), in a 100 kb window around each SNP. f Phenome-wide association study of the SNP rs776746, based on 778 phenotypic traits measured by the UK biobank study63. The dashed line indicates the Bonferroni-corrected significance threshold. For significantly associated traits, arrows indicate the direction of the effect of the derived allele (c). Source data are provided as a Source Data file

