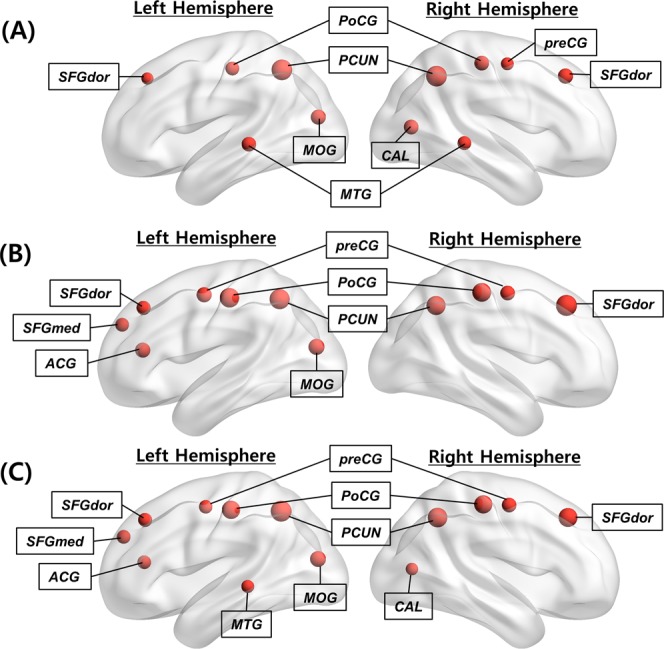
Figure 1.

Distribution of network hub nodes based on CD,node, CB,node and CP,node. (A) Network hub nodes based on CD,node are highlighted by the red circles. (B) Network hub nodes based on CB,node are highlighted by the red circles. (C) Network hub nodes based on CP,node are highlighted by the red circles. The network hub nodes were identified when the network nodes were greater than one standard deviation (SD) above the mean of each nodal centrality measure map. The size of each circle indicates the strength of each centrality measure.
