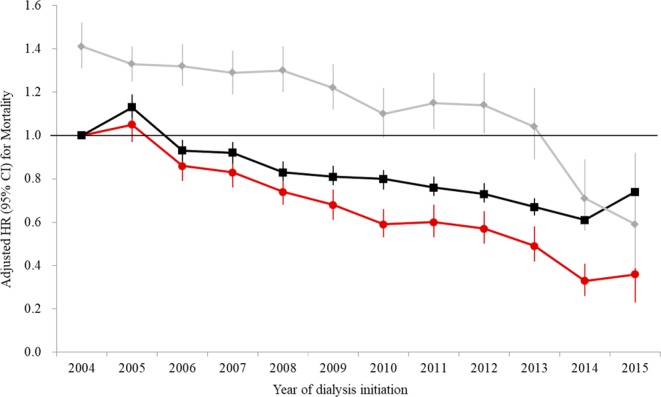
Figure 1.

Secular trend of mortality according to dialysis modality and the respective hazard of PD over HD. The black line indicates mortality trends of HD, while the red line indicates that of PD according to the year of dialysis initiation. The gray line indicates the respective hazard ratio of PD over HD. Adjusted HRs and 95% CIs were calculated by multivariate Cox proportional hazard regression analysis, entering age, sex, insurance type, income status, and CCI value as covariates. HR, hazard ratio; CI, confidence interval; HD, hemodialysis; PD, peritoneal dialysis.
