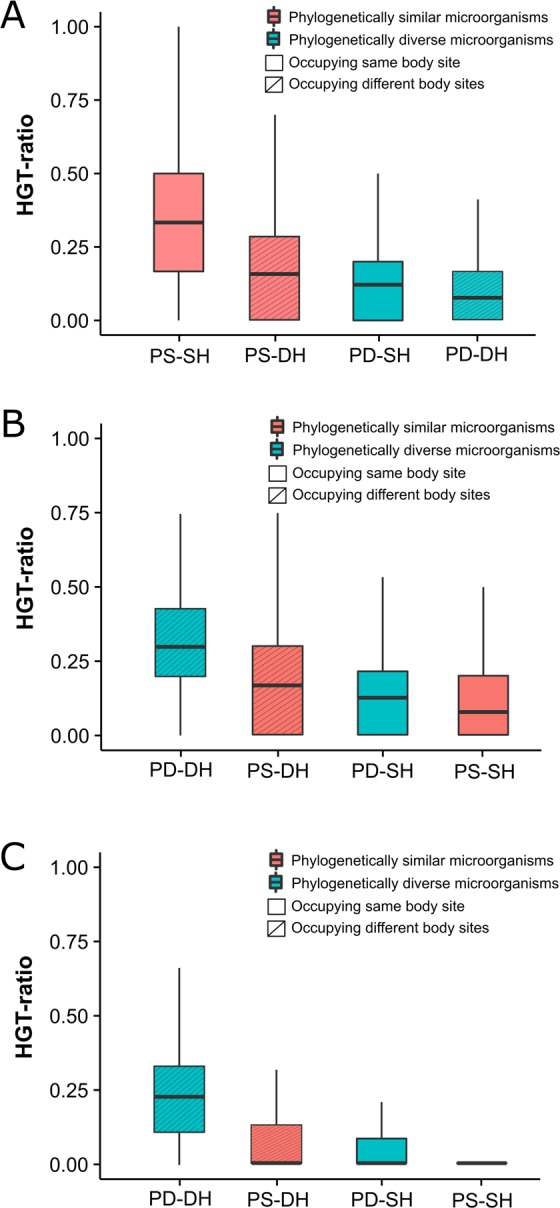
Figure 4.

Evaluation of phylogenetic versus spatial effect. HGT ratio represents the total number of one-to-one (A), one-to-many (B), and many-to-many (C) HGT events detected on a gene tree divided by the total number of HGT events (i.e. the sum of one-to-one, one-to-many, and many-to-many) detected on that gene tree. Phylogenetically similar microorganisms (PS) belong to the same genus. Phylogenetically diverse microorganisms (PD) belong to different genera. Similar habitat (SH) implies microorganisms harboring the same body site or niche. Different habitats (DH) imply microorganisms residing in different body sites or niches. See Supplementary Table S6 for P-values, pairwise Mann–Whitney U test.
